CENER


Location

lon / lat [deg]: -1.6022 / 42.8164

Source network: AERONET


Geostationary surface albedo (GSA) data


“+000”


“+057/+063”


Landcover information (based on ESA CCI landcover data)


Landcover fractions @ 2km distance


Landcover fractions @ 20 km distance


Legend


Distance to open water bodies [km]:

4.28

Distance to urban areas [km]:

0.14


Radius: 1 km

Number of landcover classes:

2

Dominant landcover type:

190: urban areas

Fraction of dominant landcover type [%]:

78.0


Radius: 2 km

Number of landcover classes:

2

Dominant landcover type:

190: urban areas

Fraction of dominant landcover type [%]:

74.0


Radius: 5 km

Number of landcover classes:

6

Dominant landcover type:

10: cropland, rainfed

Fraction of dominant landcover type [%]:

44.0


Radius: 10 km

Number of landcover classes:

8

Dominant landcover type:

10: cropland, rainfed

Fraction of dominant landcover type [%]:

50.0


Radius: 20 km

Number of landcover classes:

9

Dominant landcover type:

10: cropland, rainfed

Fraction of dominant landcover type [%]:

47.0


Disturbances


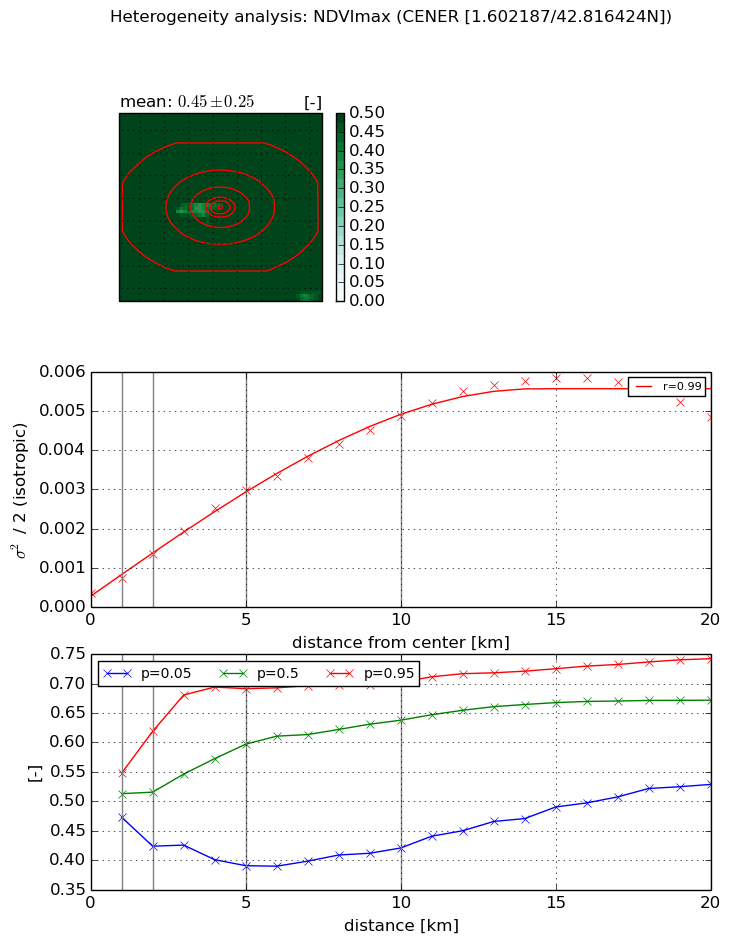
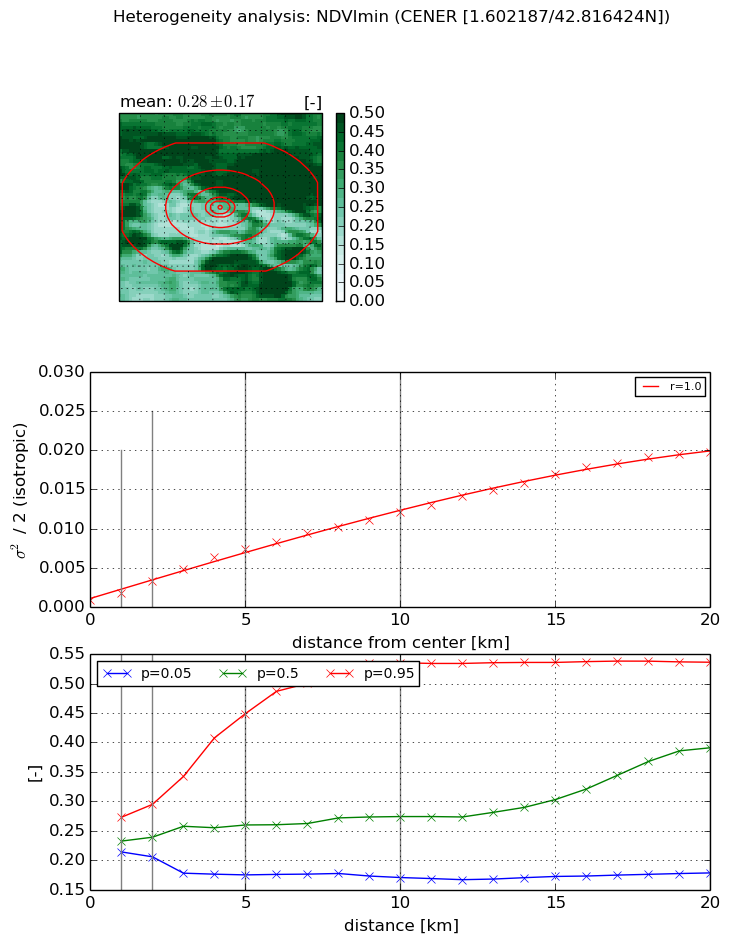
Heterogeneity analysis

The heterogeneity analysis provides information about the spatial and temporal heterogeneity of the site.

Topography


Roman et al. (2009) index


St

4.20935110506e-15

Rcv

1.14691500352

Rse

0.0

Rst

-0.0941883307189

Rsv

7.12698923213e+14


Height range @ 1km [m]

35

Height range @ 2km [m]

69

Height range @ 5km [m]

217

Height range @ 10km [m]

-999

Height range @ 20km [m]

-999


Variance slope @ 1 km

1987

Variance slope @ 2 km

1735

Variance slope @ 5 km

979

Variance slope @ 10 km

-999

Variance slope @ 20 km

-999


NDVI (max. NDVI composite)


Roman et al. (2009) index


St

6.76573093259

Rcv

0.158935973018

Rse

0.0

Rst

-0.0354976631992

Rsv

0.248977434943


NDVI range @ 1km [-]

0.08

NDVI range @ 2km [-]

0.2

NDVI range @ 5km [-]

0.3

NDVI range @ 10km [-]

0.28

NDVI range @ 20km [-]

0.21


Variance slope @ 1 km

0.00039987572631

Variance slope @ 2 km

0.000499059788859

Variance slope @ 5 km

0.000543532698771

Variance slope @ 10 km

0.000460799059077

Variance slope @ 20 km

0.000257632054559


NDVI (min. NDVI composite)I


Roman et al. (2009) index


St

0.0560718536146

Rcv

0.618081693681

Rse

0.0

Rst

6.36208440287e-07

Rsv

52.8846968117


NDVI range @ 1km [-]

0.06

NDVI range @ 2km [-]

0.09

NDVI range @ 5km [-]

0.27

NDVI range @ 10km [-]

0.37

NDVI range @ 20km [-]

0.36


NDVI slope @ 1 km

0.000968586417982

NDVI slope @ 2 km

0.00124841513849

NDVI slope @ 5 km

0.00138178568915

NDVI slope @ 10 km

0.00114301916135

NDVI slope @ 20 km

0.000961508163654


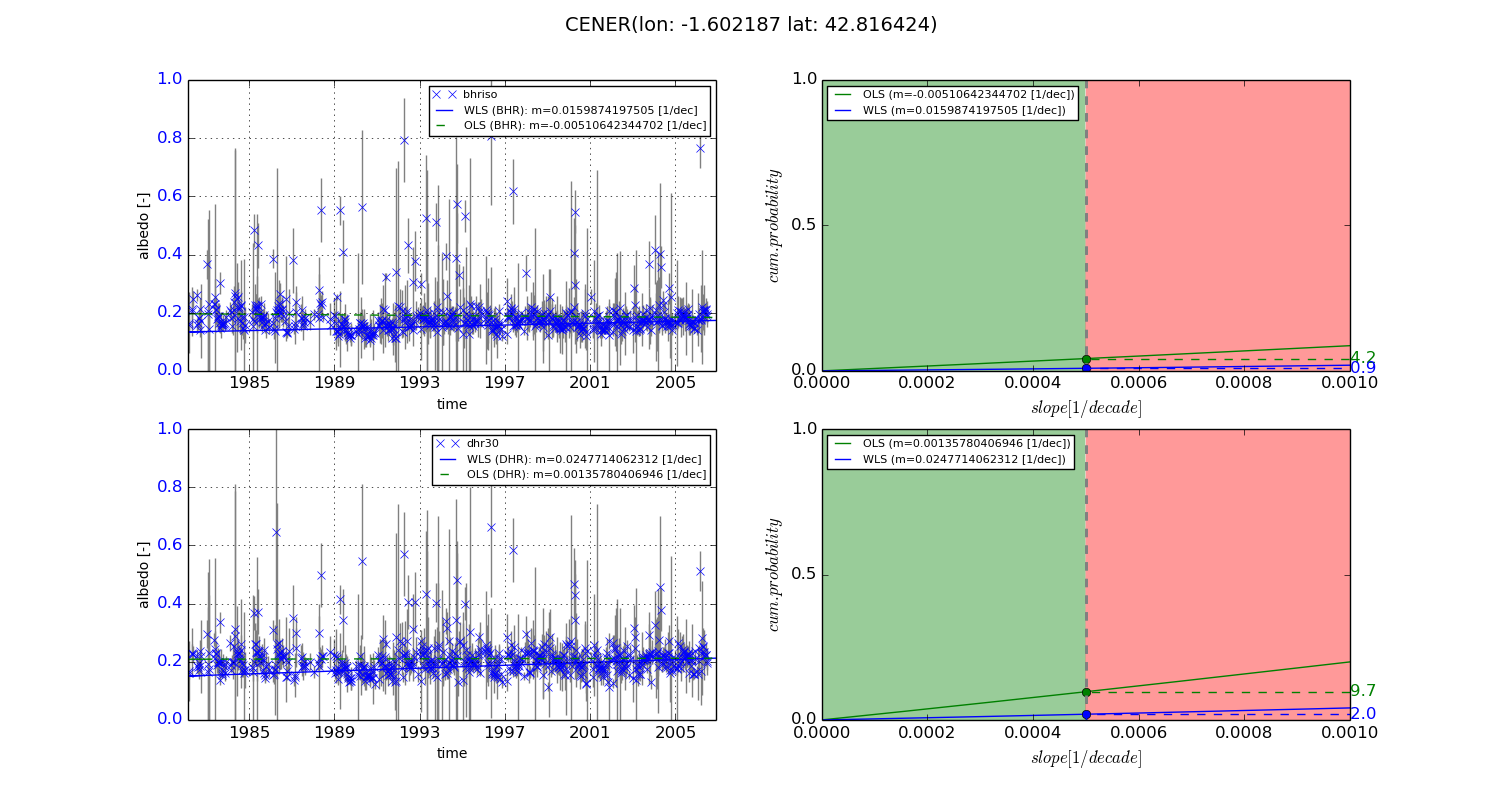
Temporal stability analysis

+000 deg (BHR)


BHR statistics

Temporal stability [1/decade]:


abs

rel


Weighted least square:

0.0159874197505


Ordinary least square:

-0.00510642344702


Probabilities that GCOS criteria is met:

Weighted least square:

0.9 %

Ordinary least square:

4.2 %


DHR statistics

Temporal stability [1/decade]:


abs

rel


Weighted least square:

0.0247714062312


Ordinary least square:

0.00135780406946


Probabilities that GCOS criteria is met:

Weighted least square:

2.0 %

Ordinary least square:

9.7 %


+057/+063 deg (BHR)


BHR statistics

Temporal stability [1/decade]:


abs

rel


Weighted least square:

-99999.0


Ordinary least square:

-99999.0


Probabilities that GCOS criteria is met:

Weighted least square:

-99999.0 %

Ordinary least square:

-99999.0 %


DHR statistics

Temporal stability [1/decade]:


abs

rel


Weighted least square:

-99999.0


Ordinary least square:

-99999.0


Probabilities that GCOS criteria is met:

Weighted least square:

-99999.0 %

Ordinary least square:

-99999.0 %


Temporal anomaly analyis

The variance of the temporal anomalies provides an additional measure about the stability of the signal AFTER removal of the mean seasonal cylce.
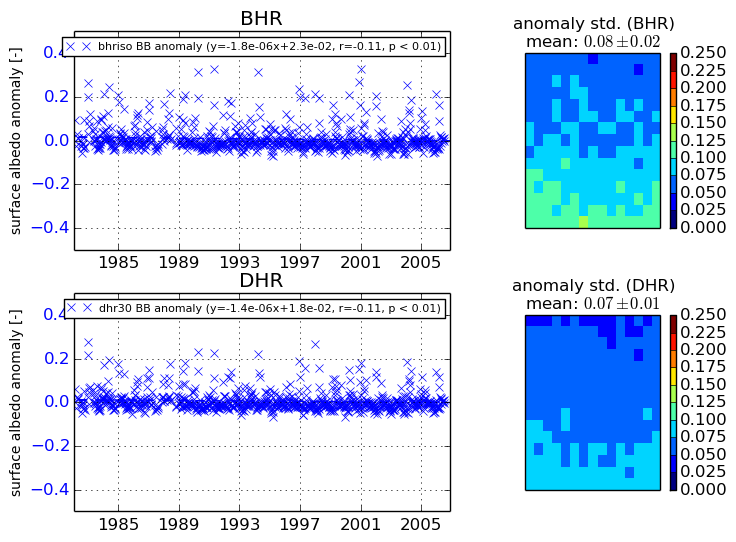
+000 deg


+057/+063 deg