CENTRAL_ARIZONA_-_PHOENIX_LTER_CAP


Location

lon / lat [deg]: -111.93 / 33.43

Source network: LTER


Geostationary surface albedo (GSA) data


“+000”


“+057/+063”


Landcover information (based on ESA CCI landcover data)


Landcover fractions @ 2km distance


Landcover fractions @ 20 km distance


Legend


Distance to open water bodies [km]:

0.28

Distance to urban areas [km]:

0.12


Radius: 1 km

Number of landcover classes:

2

Dominant landcover type:

190: urban areas

Fraction of dominant landcover type [%]:

90.0


Radius: 2 km

Number of landcover classes:

3

Dominant landcover type:

190: urban areas

Fraction of dominant landcover type [%]:

94.0


Radius: 5 km

Number of landcover classes:

3

Dominant landcover type:

190: urban areas

Fraction of dominant landcover type [%]:

92.0


Radius: 10 km

Number of landcover classes:

3

Dominant landcover type:

190: urban areas

Fraction of dominant landcover type [%]:

89.0


Radius: 20 km

Number of landcover classes:

3

Dominant landcover type:

190: urban areas

Fraction of dominant landcover type [%]:

76.0


Disturbances


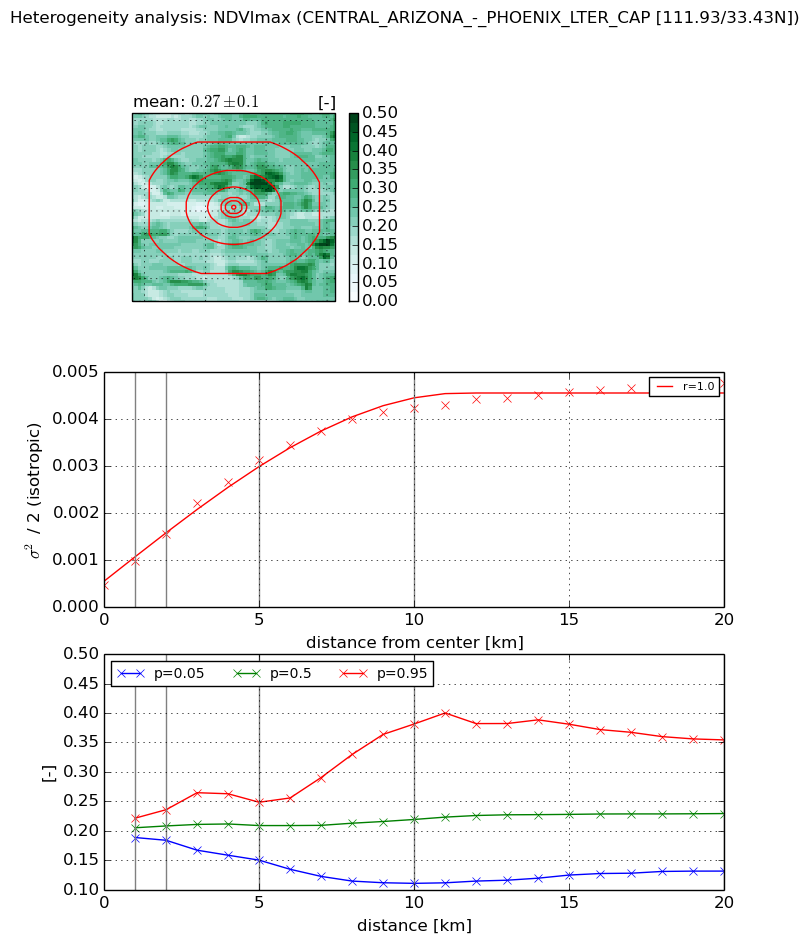
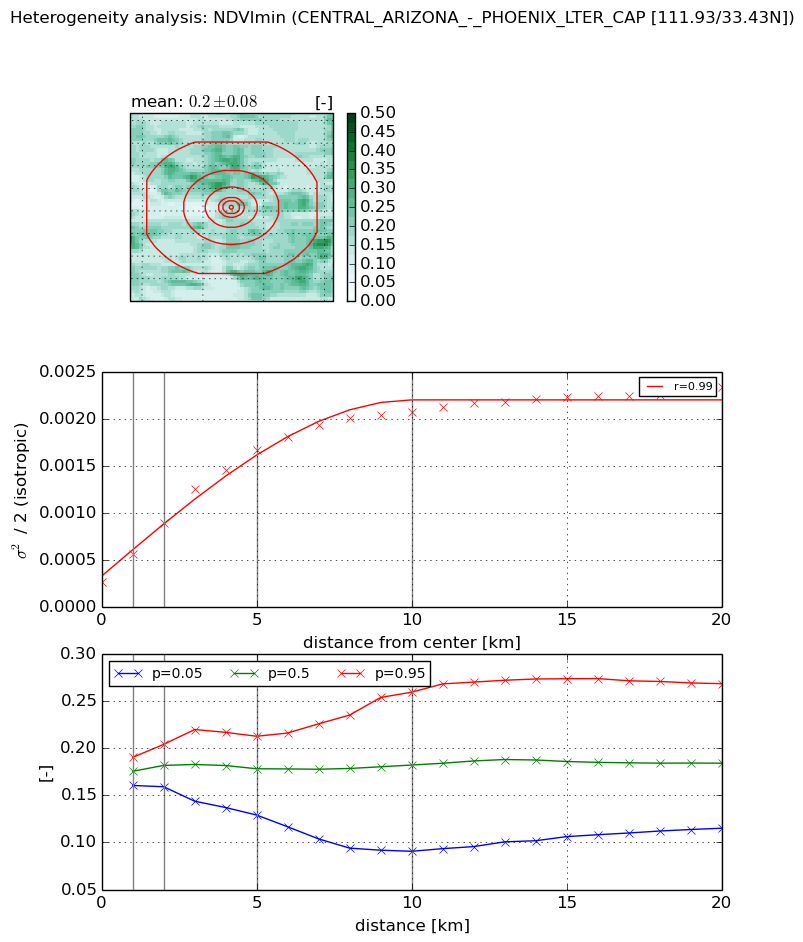
Heterogeneity analysis

The heterogeneity analysis provides information about the spatial and temporal heterogeneity of the site.

Topography


Roman et al. (2009) index


St

2.53308181694

Rcv

0.379419819176

Rse

0.0

Rst

0.0125553604628

Rsv

0.792352930074


Height range @ 1km [m]

24

Height range @ 2km [m]

24

Height range @ 5km [m]

39

Height range @ 10km [m]

-999

Height range @ 20km [m]

-999


Variance slope @ 1 km

30

Variance slope @ 2 km

30

Variance slope @ 5 km

35

Variance slope @ 10 km

-999

Variance slope @ 20 km

-999


NDVI (max. NDVI composite)


Roman et al. (2009) index


St

2.81754843603

Rcv

0.0662293221312

Rse

0.0

Rst

0.552572983265

Rsv

-0.445953125826


NDVI range @ 1km [-]

0.03

NDVI range @ 2km [-]

0.05

NDVI range @ 5km [-]

0.1

NDVI range @ 10km [-]

0.27

NDVI range @ 20km [-]

0.22


Variance slope @ 1 km

0.000508351798805

Variance slope @ 2 km

0.000544259180699

Variance slope @ 5 km

0.000544803022279

Variance slope @ 10 km

0.000388009611208

Variance slope @ 20 km

0.000187959025667


NDVI (min. NDVI composite)I


Roman et al. (2009) index


St

3.77918142573

Rcv

0.0798845424835

Rse

0.0

Rst

0.552645612341

Rsv

0.161292544338


NDVI range @ 1km [-]

0.03

NDVI range @ 2km [-]

0.04

NDVI range @ 5km [-]

0.08

NDVI range @ 10km [-]

0.17

NDVI range @ 20km [-]

0.15


NDVI slope @ 1 km

0.000291177740749

NDVI slope @ 2 km

0.000311646175453

NDVI slope @ 5 km

0.000285890842873

NDVI slope @ 10 km

0.000181632720192

NDVI slope @ 20 km

8.36057335663e-05


Temporal stability analysis

+000 deg (BHR)


BHR statistics

Temporal stability [1/decade]:


abs

rel


Weighted least square:

None


Ordinary least square:

None


Probabilities that GCOS criteria is met:

Weighted least square:

None %

Ordinary least square:

None %


DHR statistics

Temporal stability [1/decade]:


abs

rel


Weighted least square:

None


Ordinary least square:

None


Probabilities that GCOS criteria is met:

Weighted least square:

None %

Ordinary least square:

None %


+057/+063 deg (BHR)


BHR statistics

Temporal stability [1/decade]:


abs

rel


Weighted least square:

None


Ordinary least square:

None


Probabilities that GCOS criteria is met:

Weighted least square:

None %

Ordinary least square:

None %


DHR statistics

Temporal stability [1/decade]:


abs

rel


Weighted least square:

None


Ordinary least square:

None


Probabilities that GCOS criteria is met:

Weighted least square:

None %

Ordinary least square:

None %


Temporal anomaly analyis

The variance of the temporal anomalies provides an additional measure about the stability of the signal AFTER removal of the mean seasonal cylce.

+000 deg


+057/+063 deg