CH-OE1


Location

lon / lat [deg]: 7.7321 / 47.2856

Source network: FLUXNET


Geostationary surface albedo (GSA) data


“+000”


“+057/+063”


Landcover information (based on ESA CCI landcover data)


Landcover fractions @ 2km distance


Landcover fractions @ 20 km distance


Legend


Distance to open water bodies [km]:

4.94

Distance to urban areas [km]:

0.1


Radius: 1 km

Number of landcover classes:

2

Dominant landcover type:

10: cropland, rainfed

Fraction of dominant landcover type [%]:

62.0


Radius: 2 km

Number of landcover classes:

8

Dominant landcover type:

10: cropland, rainfed

Fraction of dominant landcover type [%]:

54.0


Radius: 5 km

Number of landcover classes:

8

Dominant landcover type:

10: cropland, rainfed

Fraction of dominant landcover type [%]:

36.0


Radius: 10 km

Number of landcover classes:

8

Dominant landcover type:

10: cropland, rainfed

Fraction of dominant landcover type [%]:

29.0


Radius: 20 km

Number of landcover classes:

9

Dominant landcover type:

10: cropland, rainfed

Fraction of dominant landcover type [%]:

29.0


Disturbances


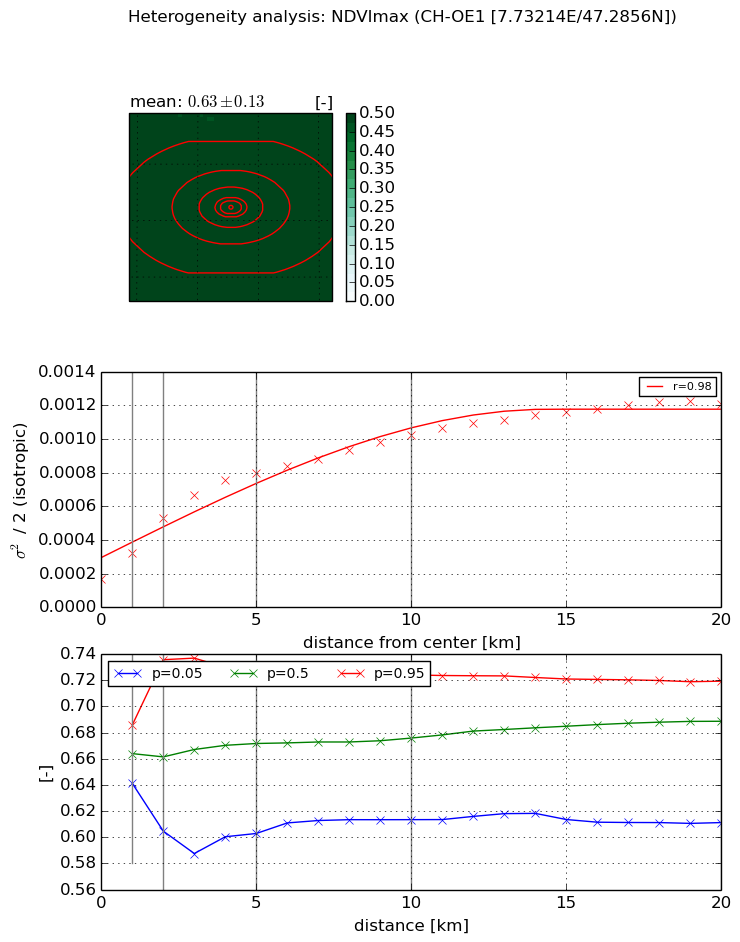
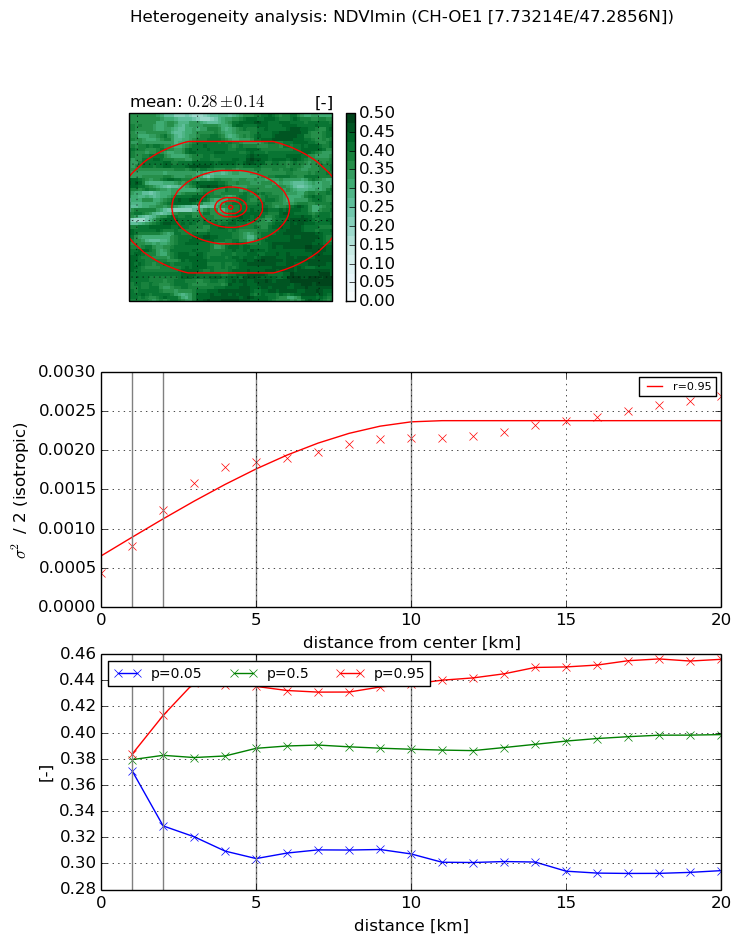
Heterogeneity analysis

The heterogeneity analysis provides information about the spatial and temporal heterogeneity of the site.

Topography


Roman et al. (2009) index


St

9.29572231466

Rcv

0.149985798873

Rse

0.0

Rst

0.0373636425747

Rsv

-0.135379648175


Height range @ 1km [m]

15

Height range @ 2km [m]

209

Height range @ 5km [m]

441

Height range @ 10km [m]

-999

Height range @ 20km [m]

-999


Variance slope @ 1 km

6132

Variance slope @ 2 km

7369

Variance slope @ 5 km

4225

Variance slope @ 10 km

-999

Variance slope @ 20 km

-999


NDVI (max. NDVI composite)


Roman et al. (2009) index


St

6.77580820925

Rcv

-0.152498364237

Rse

0.0

Rst

0.0550774681383

Rsv

-0.235175778555


NDVI range @ 1km [-]

0.04

NDVI range @ 2km [-]

0.13

NDVI range @ 5km [-]

0.13

NDVI range @ 10km [-]

0.11

NDVI range @ 20km [-]

0.11


Variance slope @ 1 km

0.000154086675127

Variance slope @ 2 km

0.000178826470494

Variance slope @ 5 km

0.000130155558753

Variance slope @ 10 km

7.85705013613e-05

Variance slope @ 20 km

4.48658889974e-05


NDVI (min. NDVI composite)I


Roman et al. (2009) index


St

8.91437193036e-08

Rcv

0.0657139245051

Rse

0.0

Rst

0.165568863758

Rsv

33653520.4367


NDVI range @ 1km [-]

0.01

NDVI range @ 2km [-]

0.08

NDVI range @ 5km [-]

0.13

NDVI range @ 10km [-]

0.13

NDVI range @ 20km [-]

0.16


NDVI slope @ 1 km

0.000353210809566

NDVI slope @ 2 km

0.000405869089455

NDVI slope @ 5 km

0.000298251714928

NDVI slope @ 10 km

0.000158521576931

NDVI slope @ 20 km

8.49458191657e-05


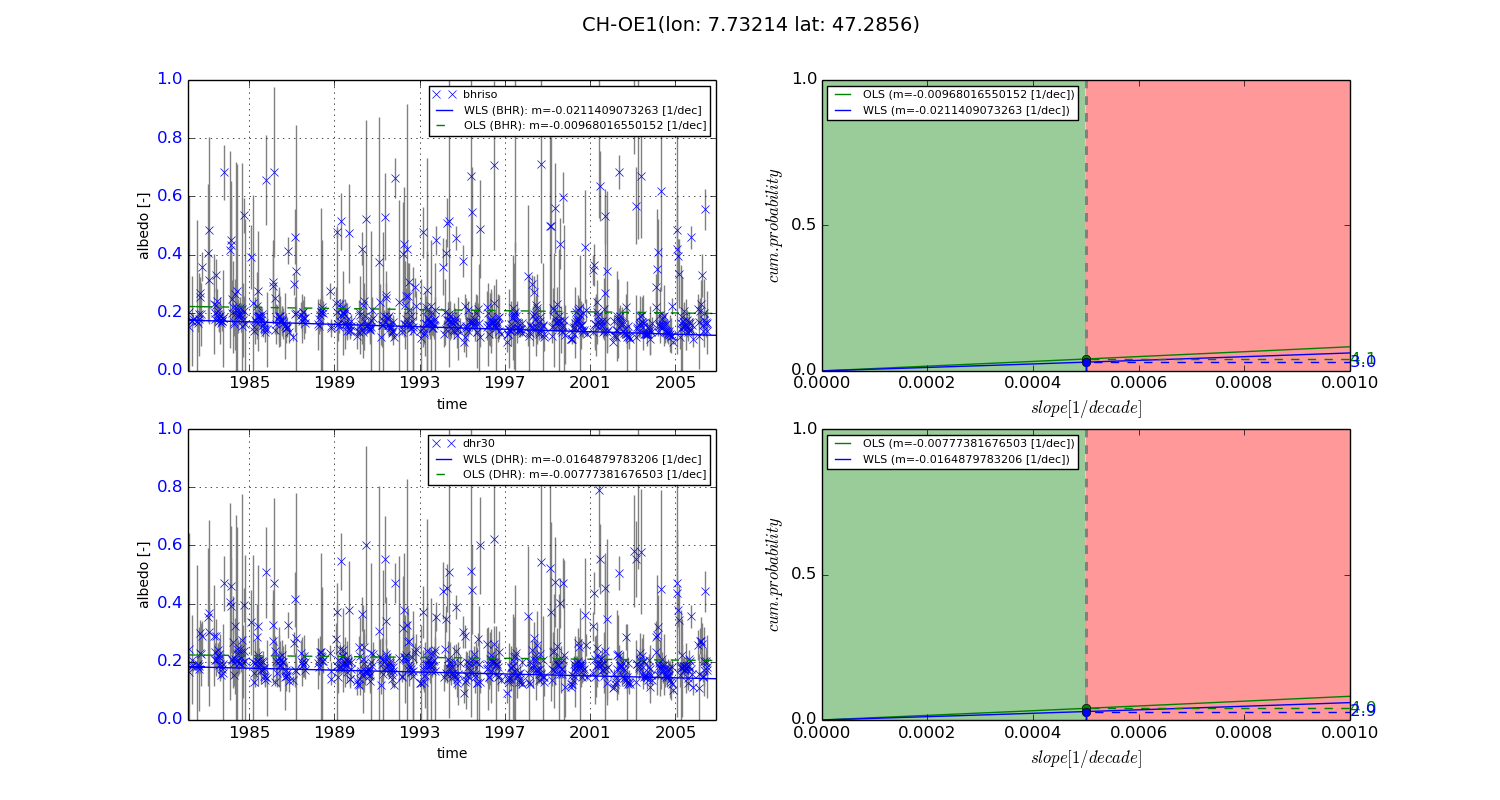
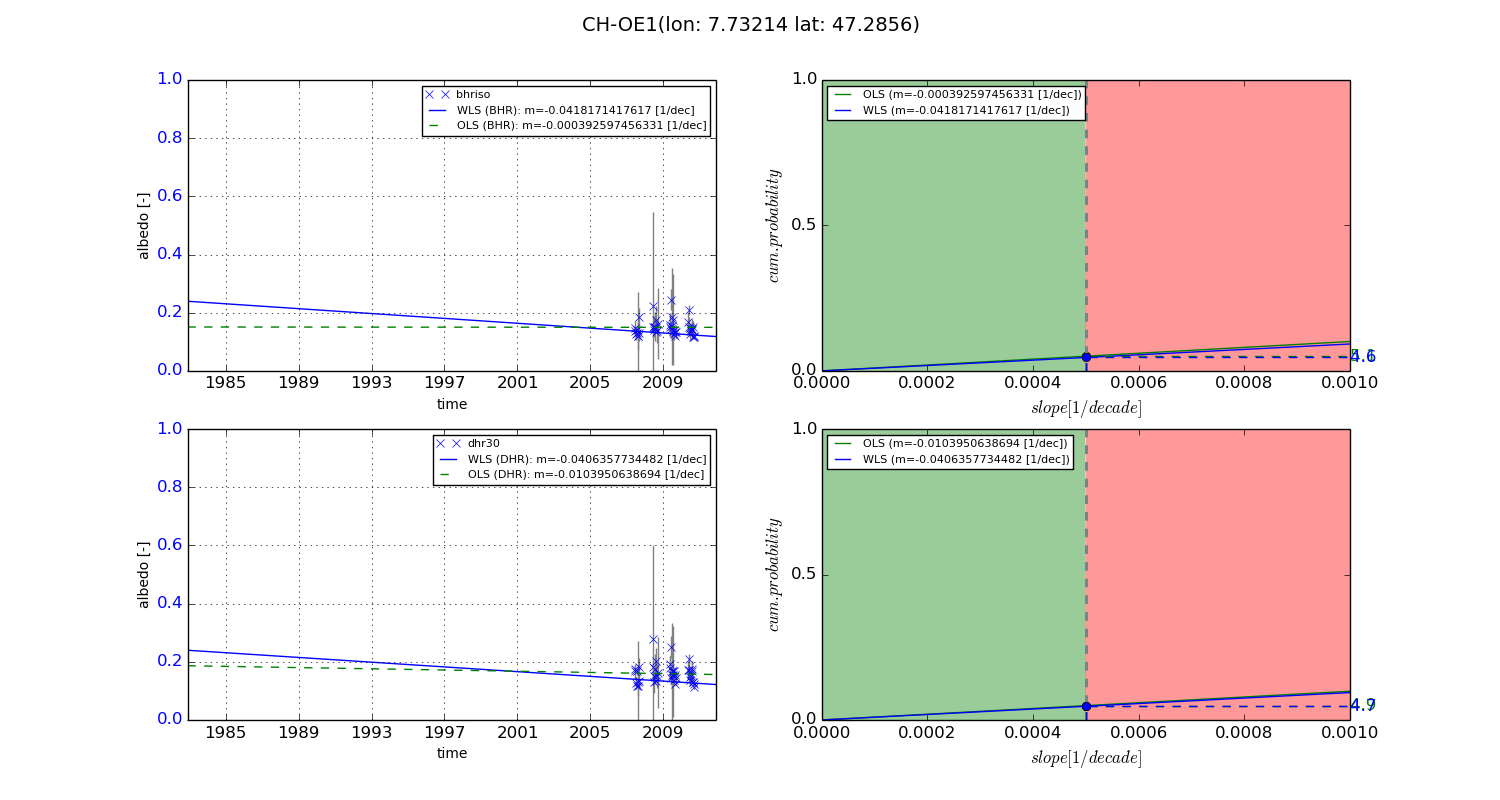
Temporal stability analysis

+000 deg (BHR)


BHR statistics

Temporal stability [1/decade]:


abs

rel


Weighted least square:

-0.0211409073263


Ordinary least square:

-0.00968016550152


Probabilities that GCOS criteria is met:

Weighted least square:

3.0 %

Ordinary least square:

4.1 %


DHR statistics

Temporal stability [1/decade]:


abs

rel


Weighted least square:

-0.0164879783206


Ordinary least square:

-0.00777381676503


Probabilities that GCOS criteria is met:

Weighted least square:

2.9 %

Ordinary least square:

4.0 %


+057/+063 deg (BHR)


BHR statistics

Temporal stability [1/decade]:


abs

rel


Weighted least square:

-0.0418171417617


Ordinary least square:

-0.000392597456331


Probabilities that GCOS criteria is met:

Weighted least square:

4.6 %

Ordinary least square:

5.1 %


DHR statistics

Temporal stability [1/decade]:


abs

rel


Weighted least square:

-0.0406357734482


Ordinary least square:

-0.0103950638694


Probabilities that GCOS criteria is met:

Weighted least square:

4.7 %

Ordinary least square:

4.9 %


Temporal anomaly analyis

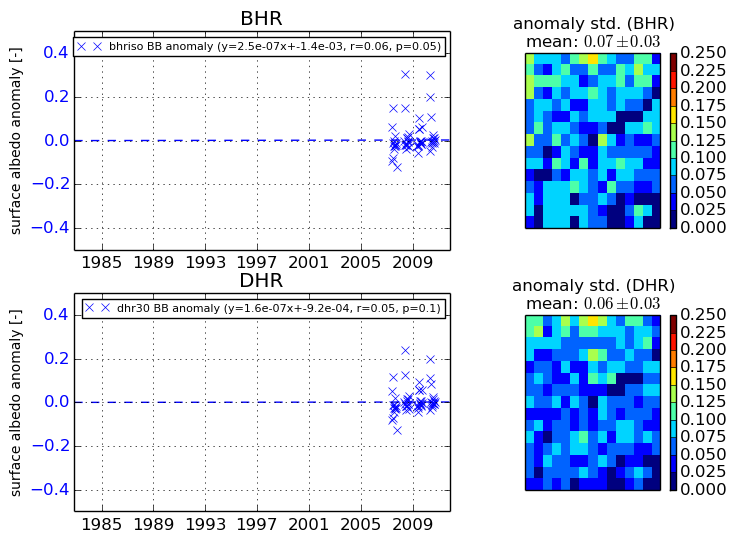
The variance of the temporal anomalies provides an additional measure about the stability of the signal AFTER removal of the mean seasonal cylce.
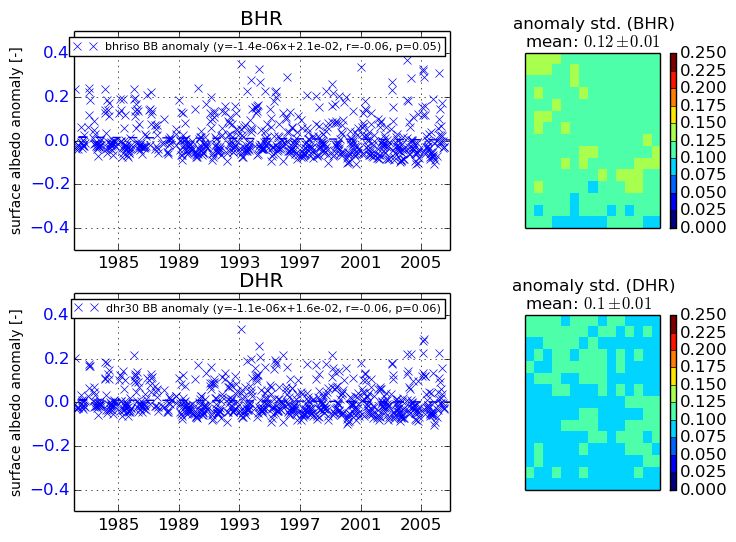
+000 deg


+057/+063 deg