CH-OE2


Location

lon / lat [deg]: 7.7343 / 47.2863

Source network: FLUXNET


Geostationary surface albedo (GSA) data


“+000”


“+057/+063”


Landcover information (based on ESA CCI landcover data)


Landcover fractions @ 2km distance


Landcover fractions @ 20 km distance


Legend


Distance to open water bodies [km]:

4.92

Distance to urban areas [km]:

0.22


Radius: 1 km

Number of landcover classes:

2

Dominant landcover type:

10: cropland, rainfed

Fraction of dominant landcover type [%]:

69.0


Radius: 2 km

Number of landcover classes:

7

Dominant landcover type:

10: cropland, rainfed

Fraction of dominant landcover type [%]:

55.0


Radius: 5 km

Number of landcover classes:

8

Dominant landcover type:

10: cropland, rainfed

Fraction of dominant landcover type [%]:

36.0


Radius: 10 km

Number of landcover classes:

8

Dominant landcover type:

10: cropland, rainfed

Fraction of dominant landcover type [%]:

28.0


Radius: 20 km

Number of landcover classes:

9

Dominant landcover type:

10: cropland, rainfed

Fraction of dominant landcover type [%]:

29.0


Disturbances


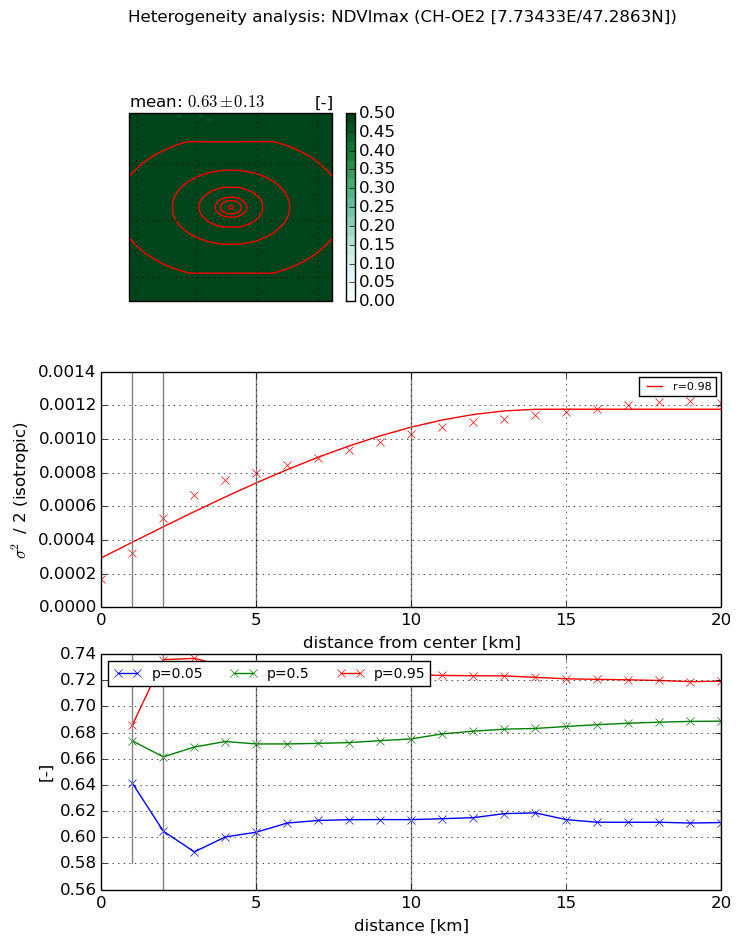
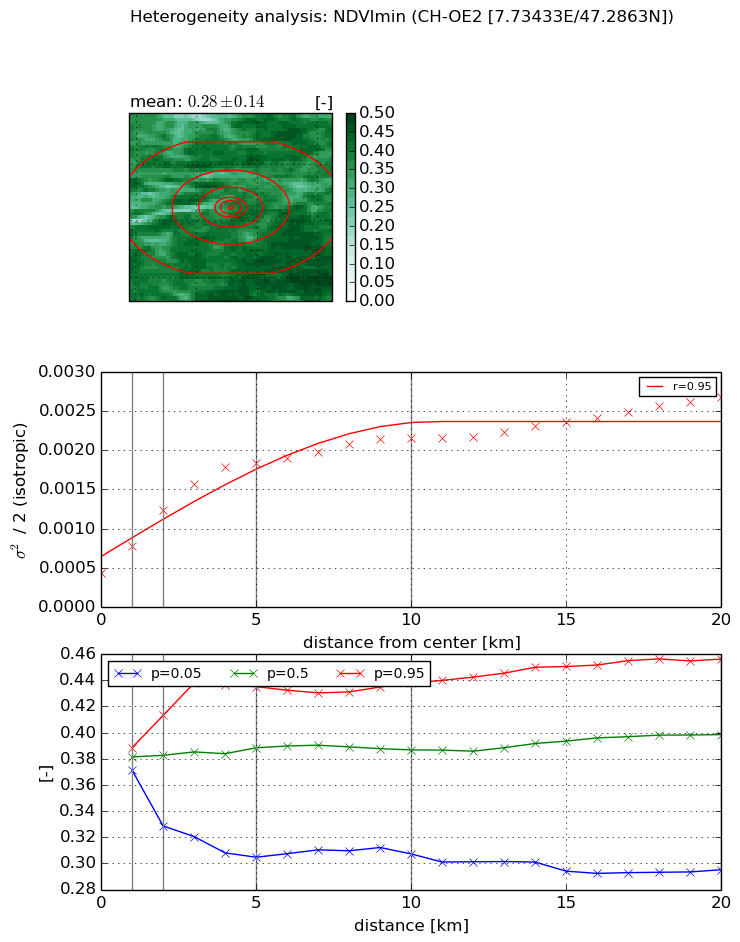
Heterogeneity analysis

The heterogeneity analysis provides information about the spatial and temporal heterogeneity of the site.

Topography


Roman et al. (2009) index


St

8.62137277765

Rcv

0.122362442417

Rse

0.0

Rst

0.00446232740516

Rsv

-0.221147656075


Height range @ 1km [m]

17

Height range @ 2km [m]

222

Height range @ 5km [m]

434

Height range @ 10km [m]

-999

Height range @ 20km [m]

-999


Variance slope @ 1 km

6056

Variance slope @ 2 km

7224

Variance slope @ 5 km

4164

Variance slope @ 10 km

-999

Variance slope @ 20 km

-999


NDVI (max. NDVI composite)


Roman et al. (2009) index


St

8.4007654446

Rcv

-0.123040849555

Rse

0.0

Rst

0.0528470940479

Rsv

-0.181222372092


NDVI range @ 1km [-]

0.04

NDVI range @ 2km [-]

0.13

NDVI range @ 5km [-]

0.12

NDVI range @ 10km [-]

0.11

NDVI range @ 20km [-]

0.11


Variance slope @ 1 km

0.000154296043898

Variance slope @ 2 km

0.000178969965474

Variance slope @ 5 km

0.000130628982375

Variance slope @ 10 km

7.89701369078e-05

Variance slope @ 20 km

4.48438954088e-05


NDVI (min. NDVI composite)I


Roman et al. (2009) index


St

3.52271974434e-05

Rcv

0.0549253427234

Rse

0.0

Rst

0.16391357995

Rsv

85161.2534814


NDVI range @ 1km [-]

0.02

NDVI range @ 2km [-]

0.08

NDVI range @ 5km [-]

0.13

NDVI range @ 10km [-]

0.13

NDVI range @ 20km [-]

0.16


NDVI slope @ 1 km

0.000350224575029

NDVI slope @ 2 km

0.000403188508053

NDVI slope @ 5 km

0.000296288684516

NDVI slope @ 10 km

0.000158814058687

NDVI slope @ 20 km

8.45116889971e-05


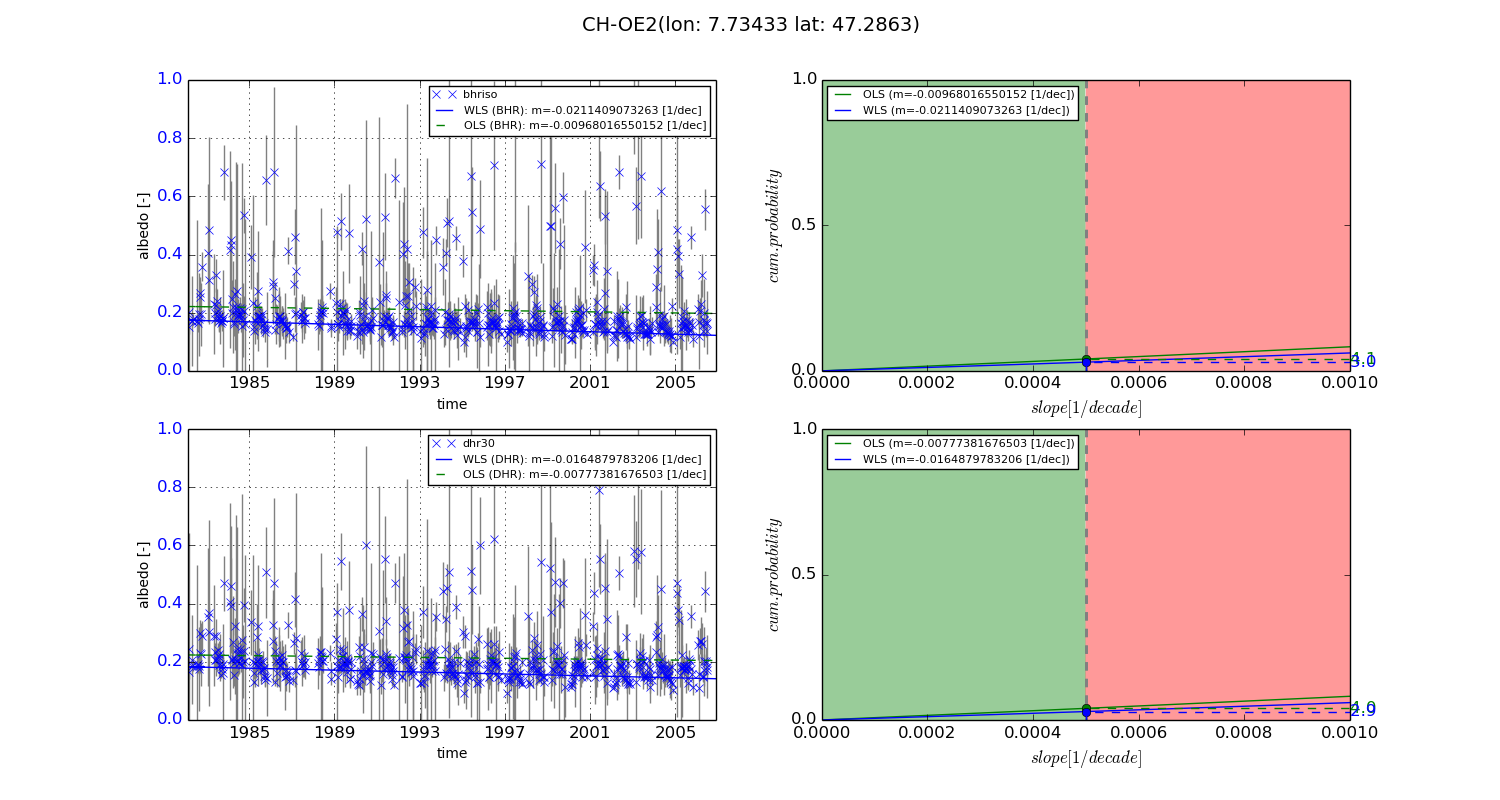
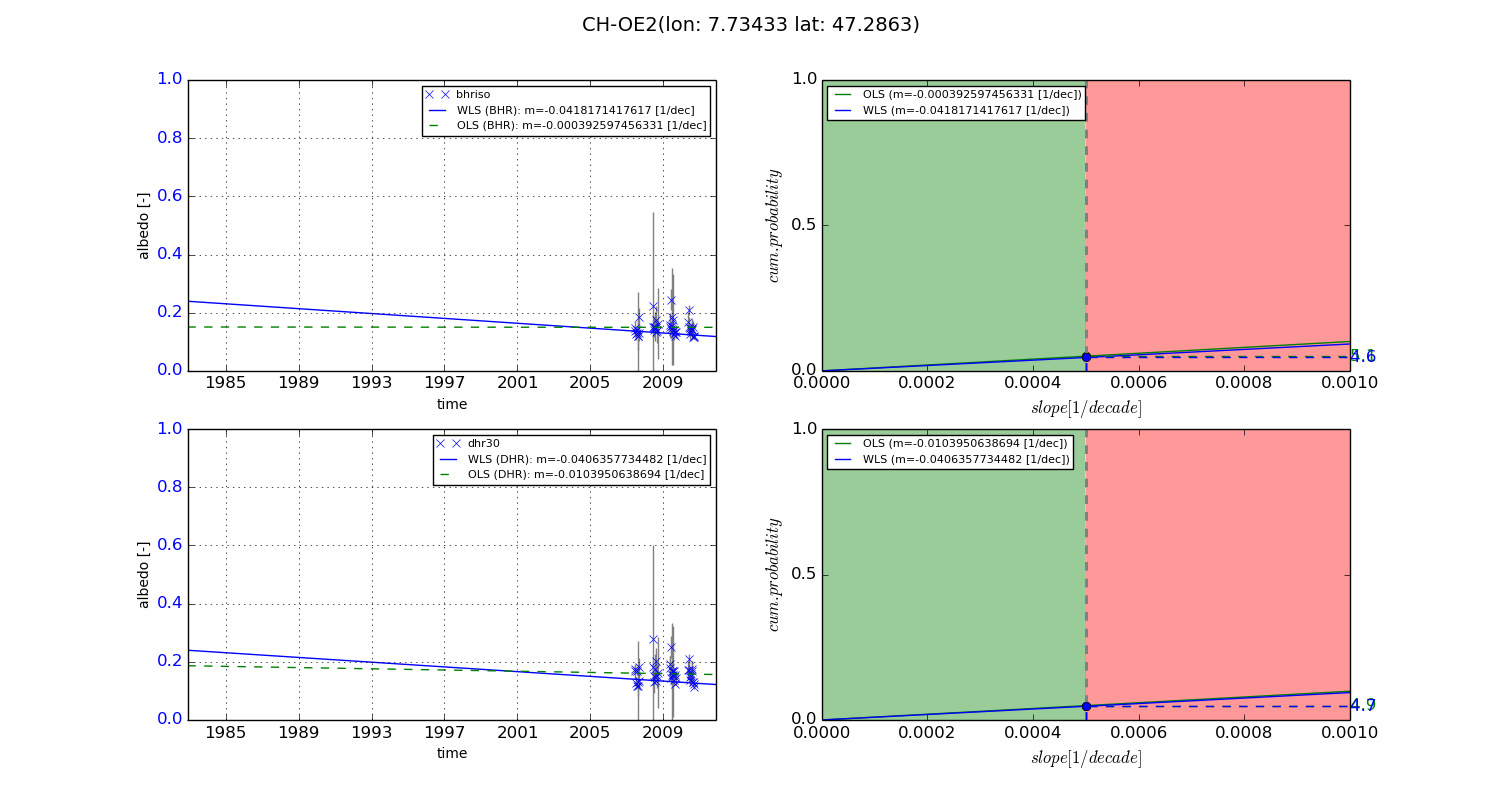
Temporal stability analysis

+000 deg (BHR)


BHR statistics

Temporal stability [1/decade]:


abs

rel


Weighted least square:

-0.0211409073263


Ordinary least square:

-0.00968016550152


Probabilities that GCOS criteria is met:

Weighted least square:

3.0 %

Ordinary least square:

4.1 %


DHR statistics

Temporal stability [1/decade]:


abs

rel


Weighted least square:

-0.0164879783206


Ordinary least square:

-0.00777381676503


Probabilities that GCOS criteria is met:

Weighted least square:

2.9 %

Ordinary least square:

4.0 %


+057/+063 deg (BHR)


BHR statistics

Temporal stability [1/decade]:


abs

rel


Weighted least square:

-0.0418171417617


Ordinary least square:

-0.000392597456331


Probabilities that GCOS criteria is met:

Weighted least square:

4.6 %

Ordinary least square:

5.1 %


DHR statistics

Temporal stability [1/decade]:


abs

rel


Weighted least square:

-0.0406357734482


Ordinary least square:

-0.0103950638694


Probabilities that GCOS criteria is met:

Weighted least square:

4.7 %

Ordinary least square:

4.9 %


Temporal anomaly analyis

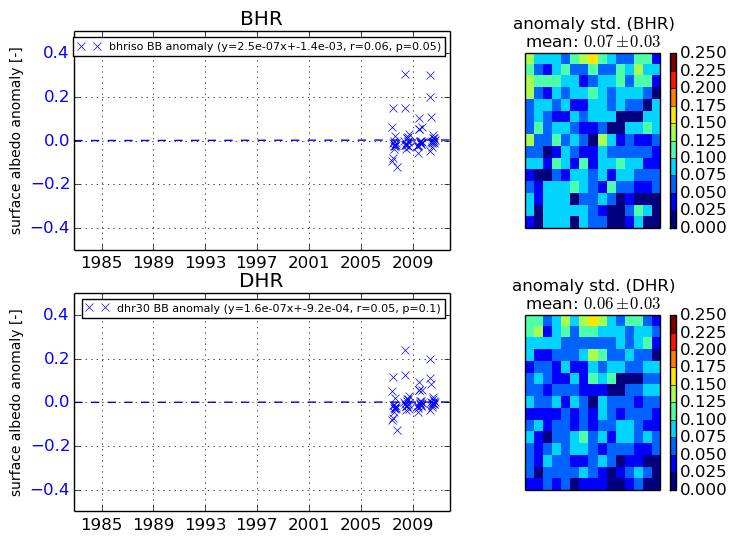
The variance of the temporal anomalies provides an additional measure about the stability of the signal AFTER removal of the mean seasonal cylce.
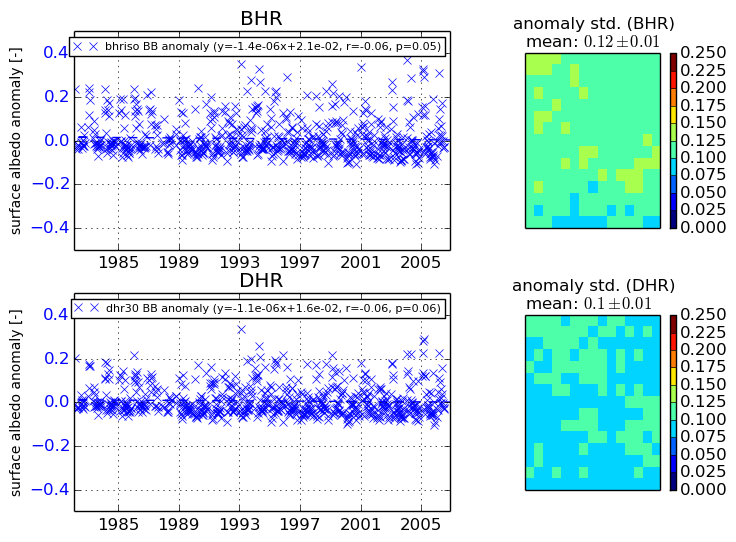
+000 deg


+057/+063 deg