CHANG_BAISHAN


Location

lon / lat [deg]: 128.0958 / 42.4025

Source network: EOS_LAND


Geostationary surface albedo (GSA) data


“+000”


“+057/+063”


Landcover information (based on ESA CCI landcover data)


Landcover fractions @ 2km distance


Landcover fractions @ 20 km distance


Legend


Distance to open water bodies [km]:

2.08

Distance to urban areas [km]:

1.25


Radius: 1 km

Number of landcover classes:

3

Dominant landcover type:

60: Tree cover, broadleaved, decidous

Fraction of dominant landcover type [%]:

71.0


Radius: 2 km

Number of landcover classes:

5

Dominant landcover type:

60: Tree cover, broadleaved, decidous

Fraction of dominant landcover type [%]:

78.0


Radius: 5 km

Number of landcover classes:

5

Dominant landcover type:

60: Tree cover, broadleaved, decidous

Fraction of dominant landcover type [%]:

73.0


Radius: 10 km

Number of landcover classes:

5

Dominant landcover type:

60: Tree cover, broadleaved, decidous

Fraction of dominant landcover type [%]:

74.0


Radius: 20 km

Number of landcover classes:

5

Dominant landcover type:

60: Tree cover, broadleaved, decidous

Fraction of dominant landcover type [%]:

77.0


Disturbances


Heterogeneity analysis

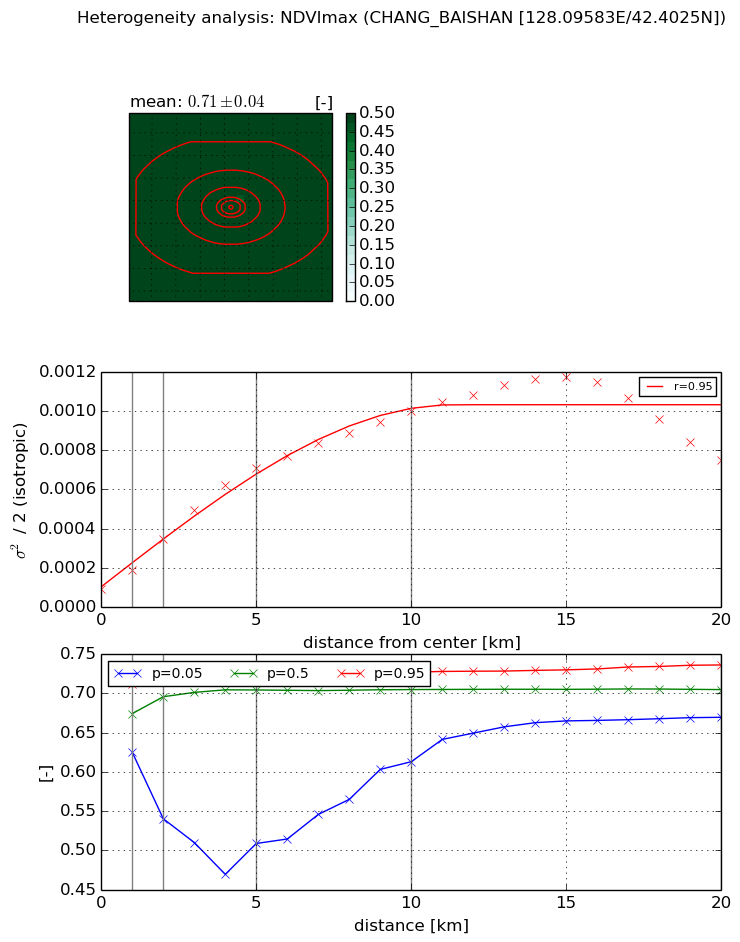
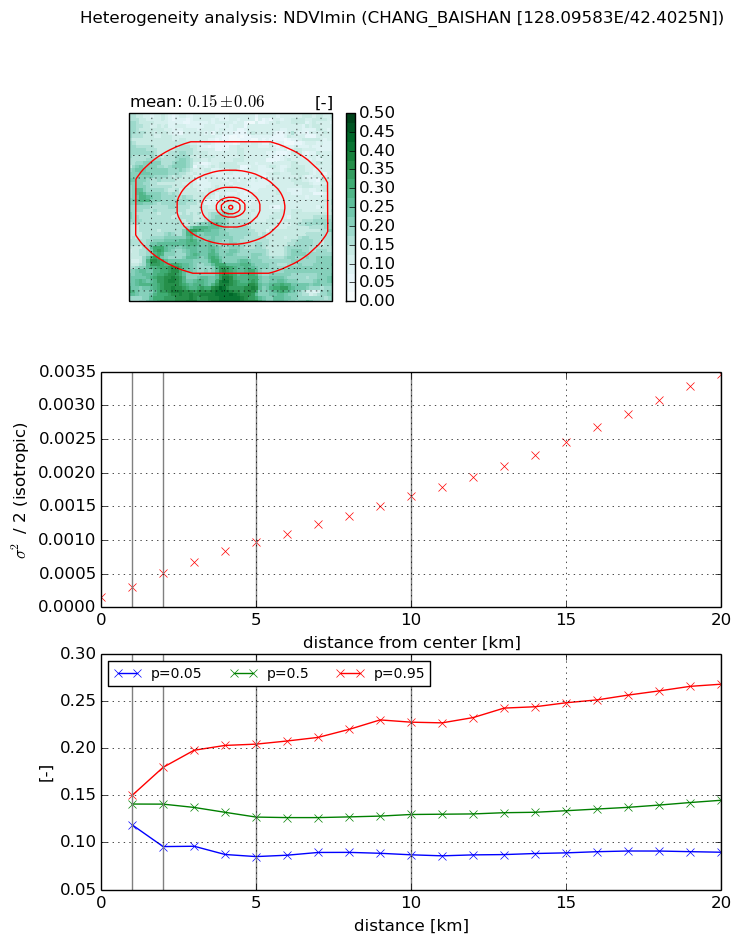
The heterogeneity analysis provides information about the spatial and temporal heterogeneity of the site.

Topography


Roman et al. (2009) index


St

4.64943740301

Rcv

0.305145371411

Rse

0.0

Rst

-2.59092064826e-08

Rsv

-0.340093959609


Height range @ 1km [m]

48

Height range @ 2km [m]

68

Height range @ 5km [m]

98

Height range @ 10km [m]

-999

Height range @ 20km [m]

-999


Variance slope @ 1 km

109

Variance slope @ 2 km

115

Variance slope @ 5 km

186

Variance slope @ 10 km

-999

Variance slope @ 20 km

-999


NDVI (max. NDVI composite)


Roman et al. (2009) index


St

10.5787161008

Rcv

0.0433530778641

Rse

0.0

Rst

-0.0988542229913

Rsv

0.141380988255


NDVI range @ 1km [-]

0.09

NDVI range @ 2km [-]

0.18

NDVI range @ 5km [-]

0.21

NDVI range @ 10km [-]

0.11

NDVI range @ 20km [-]

0.07


Variance slope @ 1 km

9.88902092404e-05

Variance slope @ 2 km

0.000126847604133

Variance slope @ 5 km

0.000129921984443

Variance slope @ 10 km

9.1159866903e-05

Variance slope @ 20 km

3.85920910221e-05


NDVI (min. NDVI composite)I


Roman et al. (2009) index


St

4.29823047684

Rcv

0.194172831555

Rse

0.0

Rst

-0.195379934732

Rsv

-0.308408875409


NDVI range @ 1km [-]

0.03

NDVI range @ 2km [-]

0.08

NDVI range @ 5km [-]

0.12

NDVI range @ 10km [-]

0.14

NDVI range @ 20km [-]

0.18


NDVI slope @ 1 km

0.000143679328084

NDVI slope @ 2 km

0.000171390056207

NDVI slope @ 5 km

0.000166285053959

NDVI slope @ 10 km

0.000147608268311

NDVI slope @ 20 km

0.000160110384718


Temporal stability analysis

+000 deg (BHR)


BHR statistics

Temporal stability [1/decade]:


abs

rel


Weighted least square:

None


Ordinary least square:

None


Probabilities that GCOS criteria is met:

Weighted least square:

None %

Ordinary least square:

None %


DHR statistics

Temporal stability [1/decade]:


abs

rel


Weighted least square:

None


Ordinary least square:

None


Probabilities that GCOS criteria is met:

Weighted least square:

None %

Ordinary least square:

None %


+057/+063 deg (BHR)


BHR statistics

Temporal stability [1/decade]:


abs

rel


Weighted least square:

-99999.0


Ordinary least square:

-99999.0


Probabilities that GCOS criteria is met:

Weighted least square:

-99999.0 %

Ordinary least square:

-99999.0 %


DHR statistics

Temporal stability [1/decade]:


abs

rel


Weighted least square:

-99999.0


Ordinary least square:

-99999.0


Probabilities that GCOS criteria is met:

Weighted least square:

-99999.0 %

Ordinary least square:

-99999.0 %


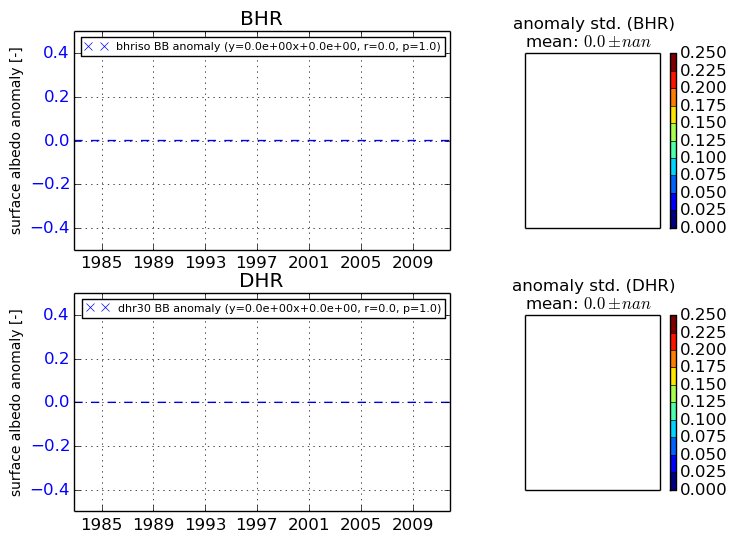
Temporal anomaly analyis

The variance of the temporal anomalies provides an additional measure about the stability of the signal AFTER removal of the mean seasonal cylce.

+000 deg


+057/+063 deg