CHAPADA


Location

lon / lat [deg]: -55.8301 / -15.3606

Source network: AERONET


Geostationary surface albedo (GSA) data


“+000”


“+057/+063”


Landcover information (based on ESA CCI landcover data)


Landcover fractions @ 2km distance


Landcover fractions @ 20 km distance


Legend


Distance to open water bodies [km]:

18.92

Distance to urban areas [km]:

13.86


Radius: 1 km

Number of landcover classes:

2

Dominant landcover type:

120: Shrubland

Fraction of dominant landcover type [%]:

88.0


Radius: 2 km

Number of landcover classes:

3

Dominant landcover type:

120: Shrubland

Fraction of dominant landcover type [%]:

75.0


Radius: 5 km

Number of landcover classes:

5

Dominant landcover type:

120: Shrubland

Fraction of dominant landcover type [%]:

51.0


Radius: 10 km

Number of landcover classes:

5

Dominant landcover type:

120: Shrubland

Fraction of dominant landcover type [%]:

57.0


Radius: 20 km

Number of landcover classes:

5

Dominant landcover type:

120: Shrubland

Fraction of dominant landcover type [%]:

49.0


Disturbances


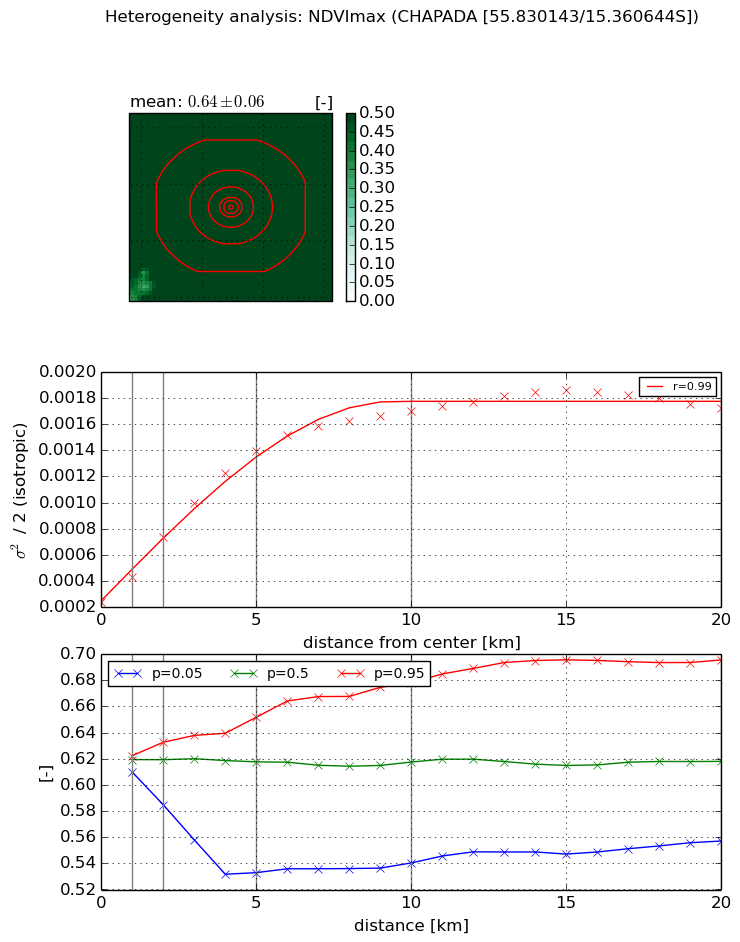
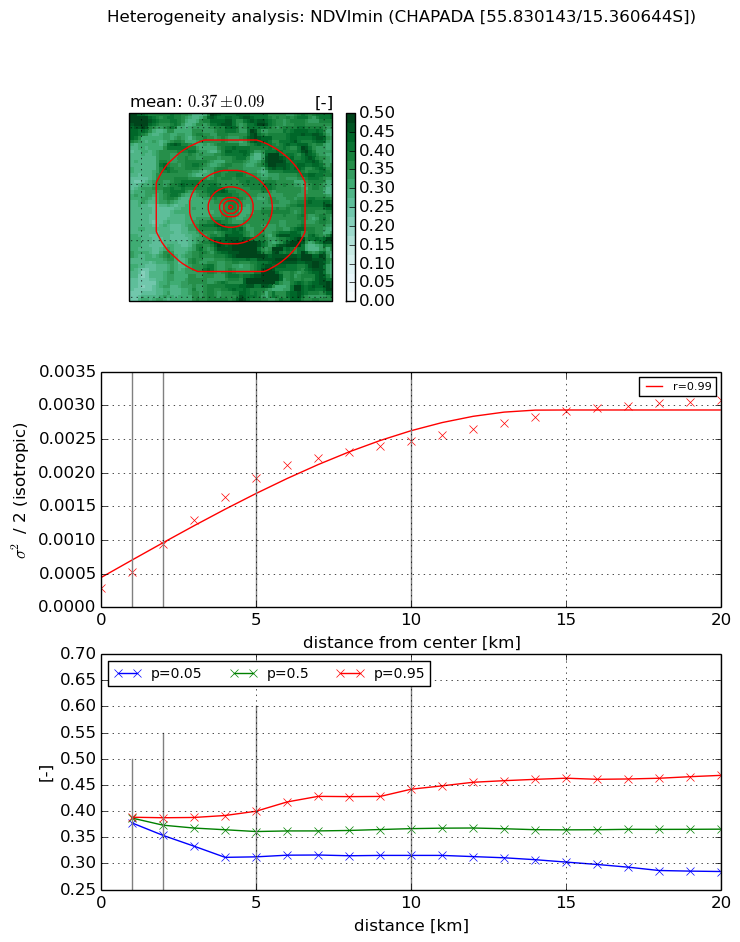
Heterogeneity analysis

The heterogeneity analysis provides information about the spatial and temporal heterogeneity of the site.

Topography


Roman et al. (2009) index


St

3.34599837882

Rcv

0.0484303338224

Rse

0.0

Rst

-7.16481912501e-08

Rsv

-0.848162975742


Height range @ 1km [m]

270

Height range @ 2km [m]

354

Height range @ 5km [m]

429

Height range @ 10km [m]

-999

Height range @ 20km [m]

-999


Variance slope @ 1 km

3796

Variance slope @ 2 km

3984

Variance slope @ 5 km

5069

Variance slope @ 10 km

-999

Variance slope @ 20 km

-999


NDVI (max. NDVI composite)


Roman et al. (2009) index


St

7.85156365525e-05

Rcv

0.431166622438

Rse

0.0

Rst

0.174893676609

Rsv

38208.3435417


NDVI range @ 1km [-]

0.01

NDVI range @ 2km [-]

0.05

NDVI range @ 5km [-]

0.12

NDVI range @ 10km [-]

0.14

NDVI range @ 20km [-]

0.14


Variance slope @ 1 km

0.00019605198182

Variance slope @ 2 km

0.00025138187262

Variance slope @ 5 km

0.000240265009203

Variance slope @ 10 km

0.000148818616773

Variance slope @ 20 km

6.42607336593e-05


NDVI (min. NDVI composite)I


Roman et al. (2009) index


St

2.96337505465

Rcv

0.370044703375

Rse

0.0

Rst

-0.127868831804

Rsv

0.514445664948


NDVI range @ 1km [-]

0.01

NDVI range @ 2km [-]

0.03

NDVI range @ 5km [-]

0.09

NDVI range @ 10km [-]

0.13

NDVI range @ 20km [-]

0.18


NDVI slope @ 1 km

0.000245581199648

NDVI slope @ 2 km

0.000324782314542

NDVI slope @ 5 km

0.000339161207778

NDVI slope @ 10 km

0.000226156057393

NDVI slope @ 20 km

0.000126720543276


Temporal stability analysis

+000 deg (BHR)


BHR statistics

Temporal stability [1/decade]:


abs

rel


Weighted least square:

-99999.0


Ordinary least square:

-99999.0


Probabilities that GCOS criteria is met:

Weighted least square:

-99999.0 %

Ordinary least square:

-99999.0 %


DHR statistics

Temporal stability [1/decade]:


abs

rel


Weighted least square:

-99999.0


Ordinary least square:

-99999.0


Probabilities that GCOS criteria is met:

Weighted least square:

-99999.0 %

Ordinary least square:

-99999.0 %


+057/+063 deg (BHR)


BHR statistics

Temporal stability [1/decade]:


abs

rel


Weighted least square:

None


Ordinary least square:

None


Probabilities that GCOS criteria is met:

Weighted least square:

None %

Ordinary least square:

None %


DHR statistics

Temporal stability [1/decade]:


abs

rel


Weighted least square:

None


Ordinary least square:

None


Probabilities that GCOS criteria is met:

Weighted least square:

None %

Ordinary least square:

None %


Temporal anomaly analyis

The variance of the temporal anomalies provides an additional measure about the stability of the signal AFTER removal of the mean seasonal cylce.

+000 deg


+057/+063 deg