CHAPAIS


Location

lon / lat [deg]: -74.9754 / 49.8224

Source network: AERONET


Geostationary surface albedo (GSA) data


“+000”


“+057/+063”


Landcover information (based on ESA CCI landcover data)


Landcover fractions @ 2km distance


Landcover fractions @ 20 km distance


Legend


Distance to open water bodies [km]:

1.37

Distance to urban areas [km]:

8.7


Radius: 1 km

Number of landcover classes:

1

Dominant landcover type:

70: Tree cover, needleleaved, evergreen, closed to open (>15%)

Fraction of dominant landcover type [%]:

100.0


Radius: 2 km

Number of landcover classes:

2

Dominant landcover type:

70: Tree cover, needleleaved, evergreen, closed to open (>15%)

Fraction of dominant landcover type [%]:

90.0


Radius: 5 km

Number of landcover classes:

4

Dominant landcover type:

70: Tree cover, needleleaved, evergreen, closed to open (>15%)

Fraction of dominant landcover type [%]:

80.0


Radius: 10 km

Number of landcover classes:

5

Dominant landcover type:

70: Tree cover, needleleaved, evergreen, closed to open (>15%)

Fraction of dominant landcover type [%]:

81.0


Radius: 20 km

Number of landcover classes:

6

Dominant landcover type:

70: Tree cover, needleleaved, evergreen, closed to open (>15%)

Fraction of dominant landcover type [%]:

70.0


Disturbances


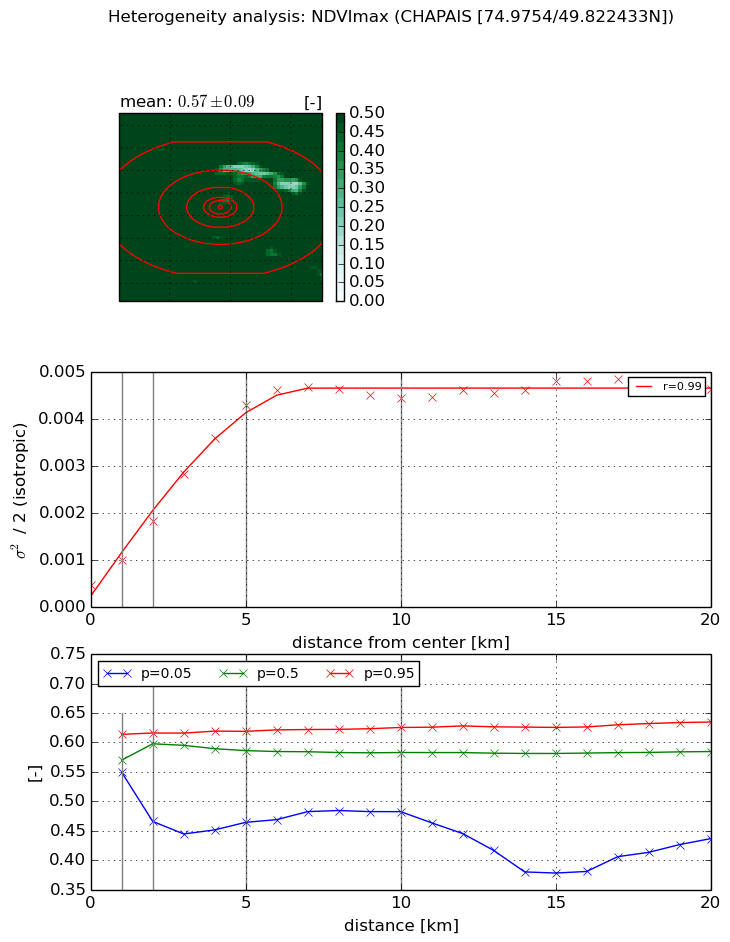
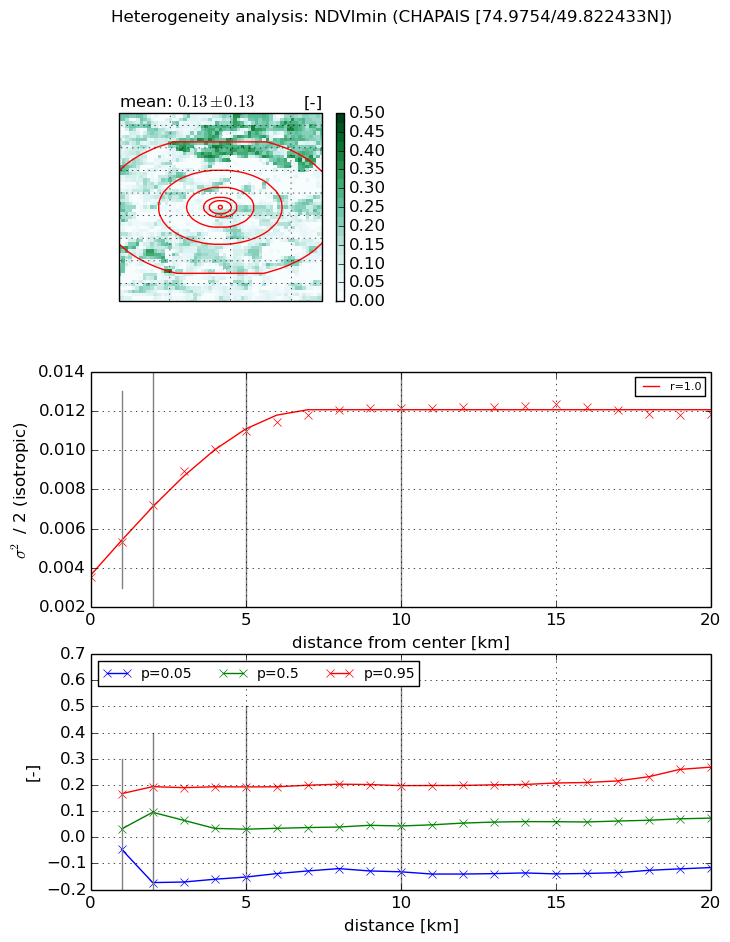
Heterogeneity analysis

The heterogeneity analysis provides information about the spatial and temporal heterogeneity of the site.

Topography


Roman et al. (2009) index


St

4.21841297639

Rcv

0.130205417081

Rse

0.0

Rst

-0.0319749857967

Rsv

0.548987521361


Height range @ 1km [m]

31

Height range @ 2km [m]

32

Height range @ 5km [m]

41

Height range @ 10km [m]

-999

Height range @ 20km [m]

-999


Variance slope @ 1 km

72

Variance slope @ 2 km

55

Variance slope @ 5 km

49

Variance slope @ 10 km

-999

Variance slope @ 20 km

-999


NDVI (max. NDVI composite)


Roman et al. (2009) index


St

3.64017285857

Rcv

-0.174491464967

Rse

0.0

Rst

0.235946567797

Rsv

-0.4136986543


NDVI range @ 1km [-]

0.06

NDVI range @ 2km [-]

0.15

NDVI range @ 5km [-]

0.15

NDVI range @ 10km [-]

0.14

NDVI range @ 20km [-]

0.2


Variance slope @ 1 km

0.000525188294981

Variance slope @ 2 km

0.00067821161768

Variance slope @ 5 km

0.000795929447197

Variance slope @ 10 km

0.0004267220991

Variance slope @ 20 km

0.000157975522195


NDVI (min. NDVI composite)I


Roman et al. (2009) index


St

10.5839047442

Rcv

0.216558692899

Rse

0.0

Rst

-0.0386465801617

Rsv

-0.0282439899948


NDVI range @ 1km [-]

0.21

NDVI range @ 2km [-]

0.37

NDVI range @ 5km [-]

0.34

NDVI range @ 10km [-]

0.33

NDVI range @ 20km [-]

0.38


NDVI slope @ 1 km

0.00178055254515

NDVI slope @ 2 km

0.00184299659191

NDVI slope @ 5 km

0.00151667790682

NDVI slope @ 10 km

0.000835258797082

NDVI slope @ 20 km

0.000292612438497


Temporal stability analysis

+000 deg (BHR)


BHR statistics

Temporal stability [1/decade]:


abs

rel


Weighted least square:

-99999.0


Ordinary least square:

-99999.0


Probabilities that GCOS criteria is met:

Weighted least square:

-99999.0 %

Ordinary least square:

-99999.0 %


DHR statistics

Temporal stability [1/decade]:


abs

rel


Weighted least square:

-99999.0


Ordinary least square:

-99999.0


Probabilities that GCOS criteria is met:

Weighted least square:

-99999.0 %

Ordinary least square:

-99999.0 %


+057/+063 deg (BHR)


BHR statistics

Temporal stability [1/decade]:


abs

rel


Weighted least square:

None


Ordinary least square:

None


Probabilities that GCOS criteria is met:

Weighted least square:

None %

Ordinary least square:

None %


DHR statistics

Temporal stability [1/decade]:


abs

rel


Weighted least square:

None


Ordinary least square:

None


Probabilities that GCOS criteria is met:

Weighted least square:

None %

Ordinary least square:

None %


Temporal anomaly analyis

The variance of the temporal anomalies provides an additional measure about the stability of the signal AFTER removal of the mean seasonal cylce.

+000 deg


+057/+063 deg