CHIANG_MAI


Location

lon / lat [deg]: 98.9869 / 18.8133

Source network: AERONET


Geostationary surface albedo (GSA) data


“+000”


“+057/+063”


Landcover information (based on ESA CCI landcover data)


Landcover fractions @ 2km distance


Landcover fractions @ 20 km distance


Legend


Distance to open water bodies [km]:

7.6

Distance to urban areas [km]:

0.11


Radius: 1 km

Number of landcover classes:

1

Dominant landcover type:

190: urban areas

Fraction of dominant landcover type [%]:

100.0


Radius: 2 km

Number of landcover classes:

4

Dominant landcover type:

190: urban areas

Fraction of dominant landcover type [%]:

83.0


Radius: 5 km

Number of landcover classes:

6

Dominant landcover type:

190: urban areas

Fraction of dominant landcover type [%]:

54.0


Radius: 10 km

Number of landcover classes:

8

Dominant landcover type:

10: cropland, rainfed

Fraction of dominant landcover type [%]:

28.0


Radius: 20 km

Number of landcover classes:

9

Dominant landcover type:

10: cropland, rainfed

Fraction of dominant landcover type [%]:

31.0


Disturbances


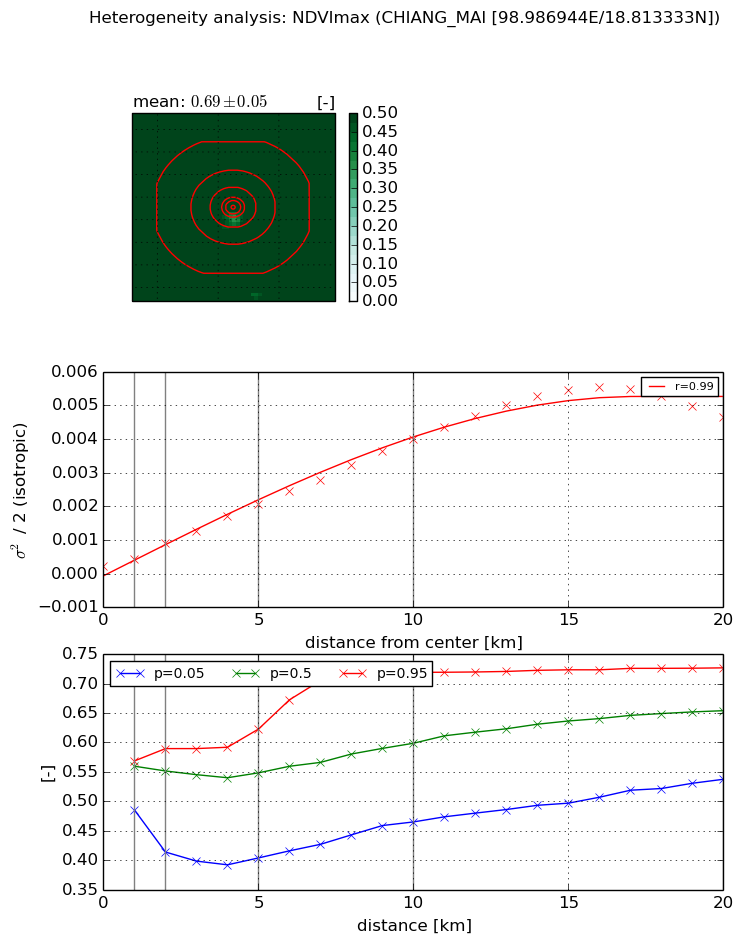
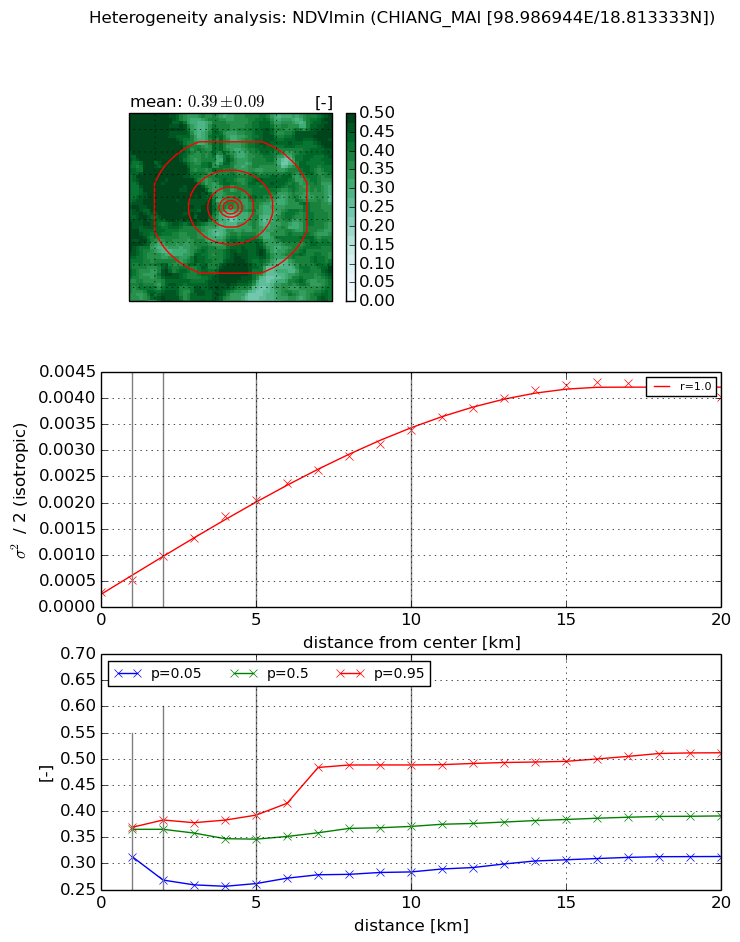
Heterogeneity analysis

The heterogeneity analysis provides information about the spatial and temporal heterogeneity of the site.

Topography


Roman et al. (2009) index


St

0.760992458825

Rcv

3.07980313075

Rse

0.0

Rst

-9.06812714918e-07

Rsv

-0.862416368445


Height range @ 1km [m]

11

Height range @ 2km [m]

14

Height range @ 5km [m]

54

Height range @ 10km [m]

-999

Height range @ 20km [m]

-999


Variance slope @ 1 km

824

Variance slope @ 2 km

937

Variance slope @ 5 km

694

Variance slope @ 10 km

-999

Variance slope @ 20 km

-999


NDVI (max. NDVI composite)


Roman et al. (2009) index


St

3.36053509338

Rcv

-0.0011402529985

Rse

0.0

Rst

-0.165338736905

Rsv

0.72623598454


NDVI range @ 1km [-]

0.08

NDVI range @ 2km [-]

0.18

NDVI range @ 5km [-]

0.22

NDVI range @ 10km [-]

0.25

NDVI range @ 20km [-]

0.19


Variance slope @ 1 km

0.000209989411065

Variance slope @ 2 km

0.000338659792804

Variance slope @ 5 km

0.000382564322201

Variance slope @ 10 km

0.000387721779066

Variance slope @ 20 km

0.00027474307168


NDVI (min. NDVI composite)I


Roman et al. (2009) index


St

3.58527054547

Rcv

-0.0457813731181

Rse

0.0

Rst

-0.196666966038

Rsv

0.59430859786


NDVI range @ 1km [-]

0.06

NDVI range @ 2km [-]

0.11

NDVI range @ 5km [-]

0.13

NDVI range @ 10km [-]

0.2

NDVI range @ 20km [-]

0.2


NDVI slope @ 1 km

0.00022876062293

NDVI slope @ 2 km

0.00034465658132

NDVI slope @ 5 km

0.000368758720623

NDVI slope @ 10 km

0.000317369840975

NDVI slope @ 20 km

0.000203268804006


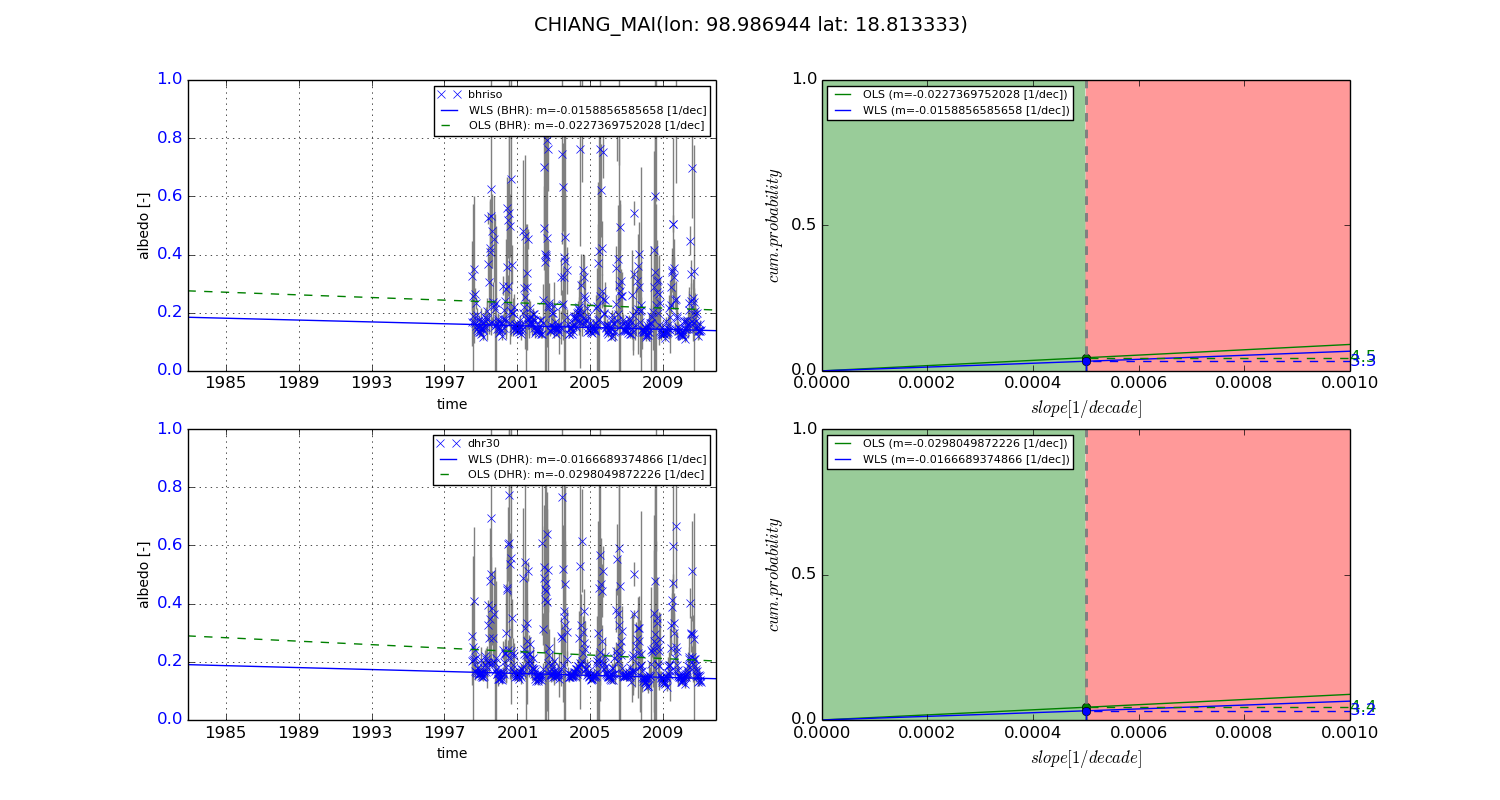
Temporal stability analysis

+000 deg (BHR)


BHR statistics

Temporal stability [1/decade]:


abs

rel


Weighted least square:

None


Ordinary least square:

None


Probabilities that GCOS criteria is met:

Weighted least square:

None %

Ordinary least square:

None %


DHR statistics

Temporal stability [1/decade]:


abs

rel


Weighted least square:

None


Ordinary least square:

None


Probabilities that GCOS criteria is met:

Weighted least square:

None %

Ordinary least square:

None %


+057/+063 deg (BHR)


BHR statistics

Temporal stability [1/decade]:


abs

rel


Weighted least square:

-0.0158856585658


Ordinary least square:

-0.0227369752028


Probabilities that GCOS criteria is met:

Weighted least square:

3.3 %

Ordinary least square:

4.5 %


DHR statistics

Temporal stability [1/decade]:


abs

rel


Weighted least square:

-0.0166689374866


Ordinary least square:

-0.0298049872226


Probabilities that GCOS criteria is met:

Weighted least square:

3.2 %

Ordinary least square:

4.4 %


Temporal anomaly analyis

The variance of the temporal anomalies provides an additional measure about the stability of the signal AFTER removal of the mean seasonal cylce.

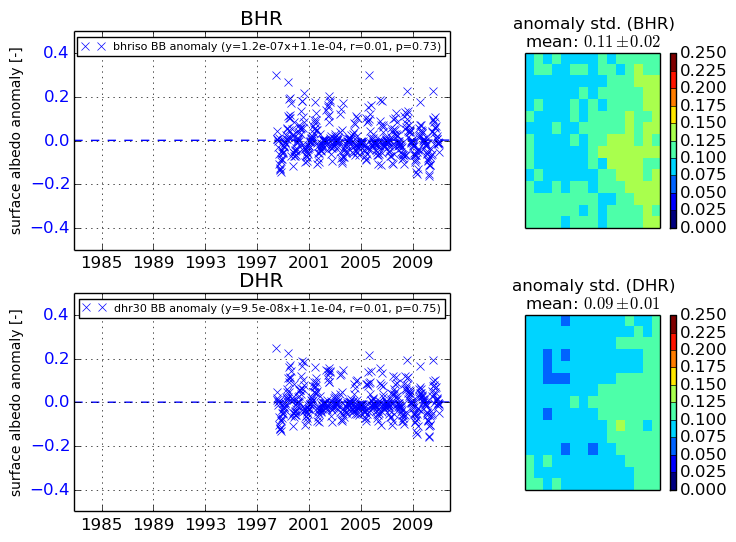
+000 deg


+057/+063 deg