CHINA_LAKE


Location

lon / lat [deg]: -117.7445 / 35.6741

Source network: AERONET


Geostationary surface albedo (GSA) data


“+000”


“+057/+063”


Landcover information (based on ESA CCI landcover data)


Landcover fractions @ 2km distance


Landcover fractions @ 20 km distance


Legend


Distance to open water bodies [km]:

8.97

Distance to urban areas [km]:

2.87


Radius: 1 km

Number of landcover classes:

1

Dominant landcover type:

120: Shrubland

Fraction of dominant landcover type [%]:

100.0


Radius: 2 km

Number of landcover classes:

1

Dominant landcover type:

120: Shrubland

Fraction of dominant landcover type [%]:

100.0


Radius: 5 km

Number of landcover classes:

2

Dominant landcover type:

120: Shrubland

Fraction of dominant landcover type [%]:

97.0


Radius: 10 km

Number of landcover classes:

3

Dominant landcover type:

120: Shrubland

Fraction of dominant landcover type [%]:

85.0


Radius: 20 km

Number of landcover classes:

3

Dominant landcover type:

120: Shrubland

Fraction of dominant landcover type [%]:

92.0


Disturbances


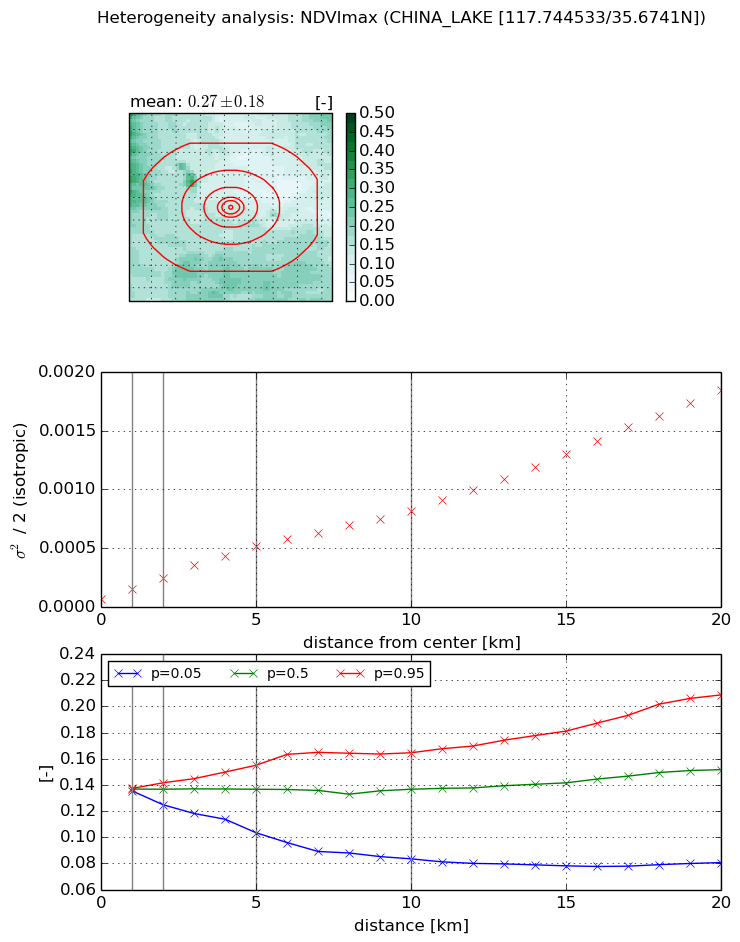
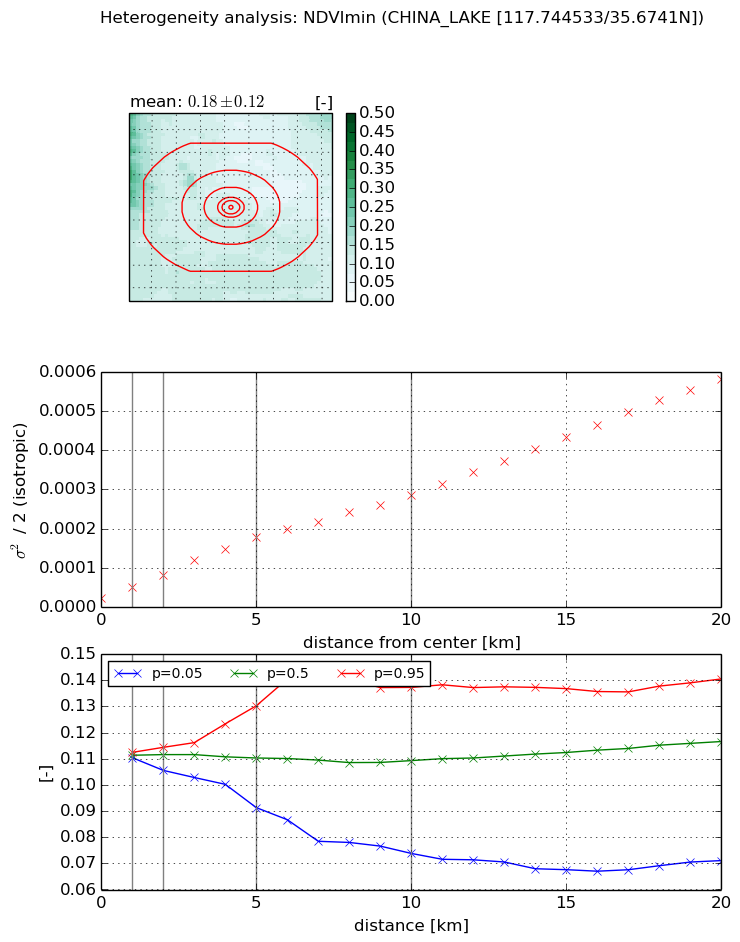
Heterogeneity analysis

The heterogeneity analysis provides information about the spatial and temporal heterogeneity of the site.

Topography


Roman et al. (2009) index


St

2.54991602652e-13

Rcv

0.672756472909

Rse

0.0

Rst

5.39313742767e-05

Rsv

1.1765093316e+13


Height range @ 1km [m]

12

Height range @ 2km [m]

23

Height range @ 5km [m]

60

Height range @ 10km [m]

-999

Height range @ 20km [m]

-999


Variance slope @ 1 km

15

Variance slope @ 2 km

29

Variance slope @ 5 km

70

Variance slope @ 10 km

-999

Variance slope @ 20 km

-999


NDVI (max. NDVI composite)


Roman et al. (2009) index


St

0.0136012321999

Rcv

0.911852816098

Rse

0.0

Rst

1.34866683474e-06

Rsv

219.656396999


NDVI range @ 1km [-]

0.0

NDVI range @ 2km [-]

0.02

NDVI range @ 5km [-]

0.05

NDVI range @ 10km [-]

0.08

NDVI range @ 20km [-]

0.13


Variance slope @ 1 km

8.74254236644e-05

Variance slope @ 2 km

9.05410420634e-05

Variance slope @ 5 km

9.15155120302e-05

Variance slope @ 10 km

7.4151357406e-05

Variance slope @ 20 km

8.5076312953e-05


NDVI (min. NDVI composite)I


Roman et al. (2009) index


St

1.45075977807

Rcv

1.65949854208

Rse

0.0

Rst

-3.99100035077e-08

Rsv

-0.408383396366


NDVI range @ 1km [-]

0.0

NDVI range @ 2km [-]

0.01

NDVI range @ 5km [-]

0.04

NDVI range @ 10km [-]

0.06

NDVI range @ 20km [-]

0.07


NDVI slope @ 1 km

2.79198612119e-05

NDVI slope @ 2 km

2.98988476669e-05

NDVI slope @ 5 km

3.18835028855e-05

NDVI slope @ 10 km

2.61498070412e-05

NDVI slope @ 20 km

2.73464664867e-05


Temporal stability analysis

+000 deg (BHR)


BHR statistics

Temporal stability [1/decade]:


abs

rel


Weighted least square:

None


Ordinary least square:

None


Probabilities that GCOS criteria is met:

Weighted least square:

None %

Ordinary least square:

None %


DHR statistics

Temporal stability [1/decade]:


abs

rel


Weighted least square:

None


Ordinary least square:

None


Probabilities that GCOS criteria is met:

Weighted least square:

None %

Ordinary least square:

None %


+057/+063 deg (BHR)


BHR statistics

Temporal stability [1/decade]:


abs

rel


Weighted least square:

None


Ordinary least square:

None


Probabilities that GCOS criteria is met:

Weighted least square:

None %

Ordinary least square:

None %


DHR statistics

Temporal stability [1/decade]:


abs

rel


Weighted least square:

None


Ordinary least square:

None


Probabilities that GCOS criteria is met:

Weighted least square:

None %

Ordinary least square:

None %


Temporal anomaly analyis

The variance of the temporal anomalies provides an additional measure about the stability of the signal AFTER removal of the mean seasonal cylce.

+000 deg


+057/+063 deg