CHITRAKOOT


Location

lon / lat [deg]: 80.8552 / 25.1479

Source network: AERONET


Geostationary surface albedo (GSA) data


“+000”


“+057/+063”


Landcover information (based on ESA CCI landcover data)


Landcover fractions @ 2km distance


Landcover fractions @ 20 km distance


Legend


Distance to open water bodies [km]:

5.04

Distance to urban areas [km]:

4.66


Radius: 1 km

Number of landcover classes:

3

Dominant landcover type:

10: cropland, rainfed

Fraction of dominant landcover type [%]:

63.0


Radius: 2 km

Number of landcover classes:

3

Dominant landcover type:

10: cropland, rainfed

Fraction of dominant landcover type [%]:

59.0


Radius: 5 km

Number of landcover classes:

4

Dominant landcover type:

10: cropland, rainfed

Fraction of dominant landcover type [%]:

68.0


Radius: 10 km

Number of landcover classes:

5

Dominant landcover type:

10: cropland, rainfed

Fraction of dominant landcover type [%]:

65.0


Radius: 20 km

Number of landcover classes:

4

Dominant landcover type:

10: cropland, rainfed

Fraction of dominant landcover type [%]:

54.0


Disturbances


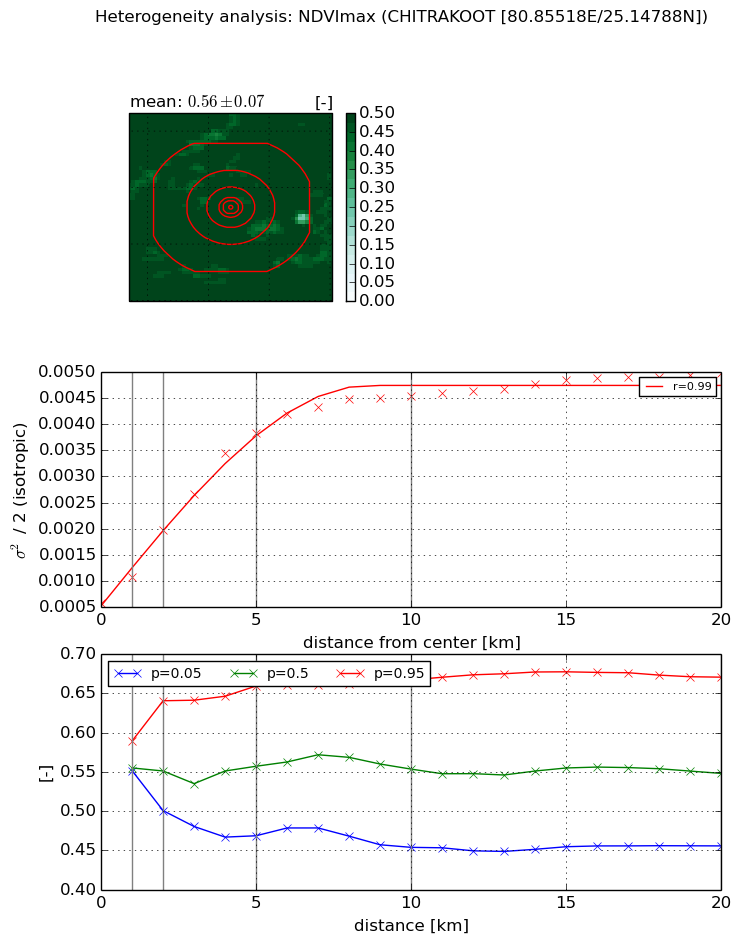
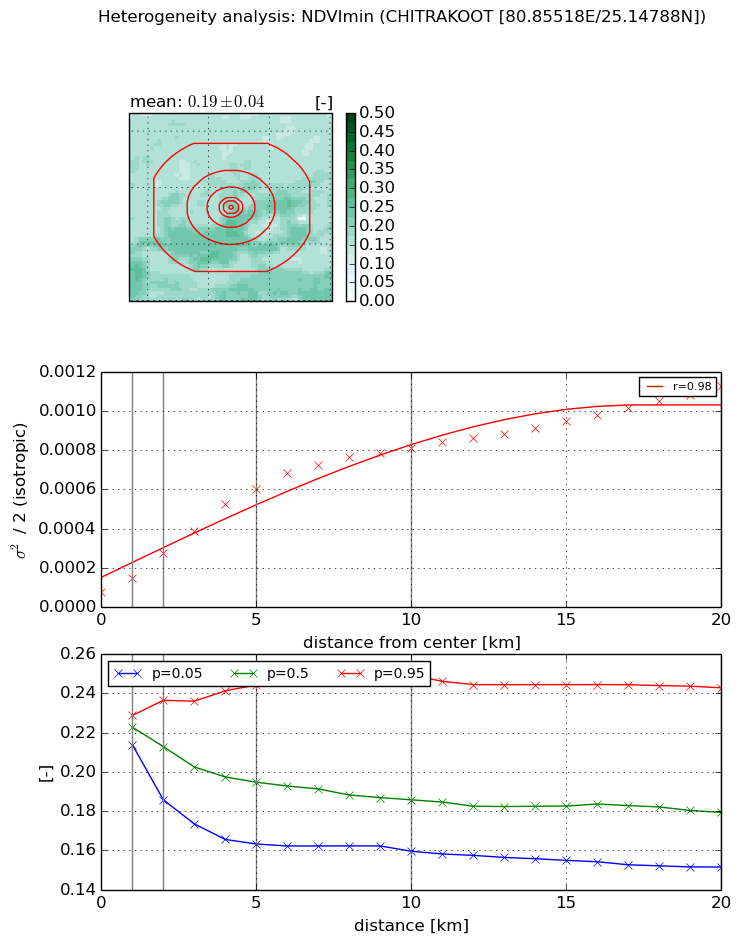
Heterogeneity analysis

The heterogeneity analysis provides information about the spatial and temporal heterogeneity of the site.

Topography


Roman et al. (2009) index


St

1.22753899775e-07

Rcv

0.174971182851

Rse

0.0

Rst

-0.105829260426

Rsv

24439141.8198


Height range @ 1km [m]

29

Height range @ 2km [m]

49

Height range @ 5km [m]

121

Height range @ 10km [m]

-999

Height range @ 20km [m]

-999


Variance slope @ 1 km

572

Variance slope @ 2 km

468

Variance slope @ 5 km

255

Variance slope @ 10 km

-999

Variance slope @ 20 km

-999


NDVI (max. NDVI composite)


Roman et al. (2009) index


St

4.2620130476

Rcv

0.172334635637

Rse

0.0

Rst

-0.156224737944

Rsv

0.375333356566


NDVI range @ 1km [-]

0.04

NDVI range @ 2km [-]

0.14

NDVI range @ 5km [-]

0.19

NDVI range @ 10km [-]

0.21

NDVI range @ 20km [-]

0.22


Variance slope @ 1 km

0.000503916506048

Variance slope @ 2 km

0.000700881437004

Variance slope @ 5 km

0.000689436409666

Variance slope @ 10 km

0.000410038843532

Variance slope @ 20 km

0.000175548591094


NDVI (min. NDVI composite)I


Roman et al. (2009) index


St

1.09268133744

Rcv

0.457429447803

Rse

0.0

Rst

-0.296919721989

Rsv

1.99119053809


NDVI range @ 1km [-]

0.01

NDVI range @ 2km [-]

0.05

NDVI range @ 5km [-]

0.08

NDVI range @ 10km [-]

0.09

NDVI range @ 20km [-]

0.09


NDVI slope @ 1 km

7.05074066979e-05

NDVI slope @ 2 km

9.96535965509e-05

NDVI slope @ 5 km

0.000110936532862

NDVI slope @ 10 km

7.75645495975e-05

NDVI slope @ 20 km

4.6278312302e-05


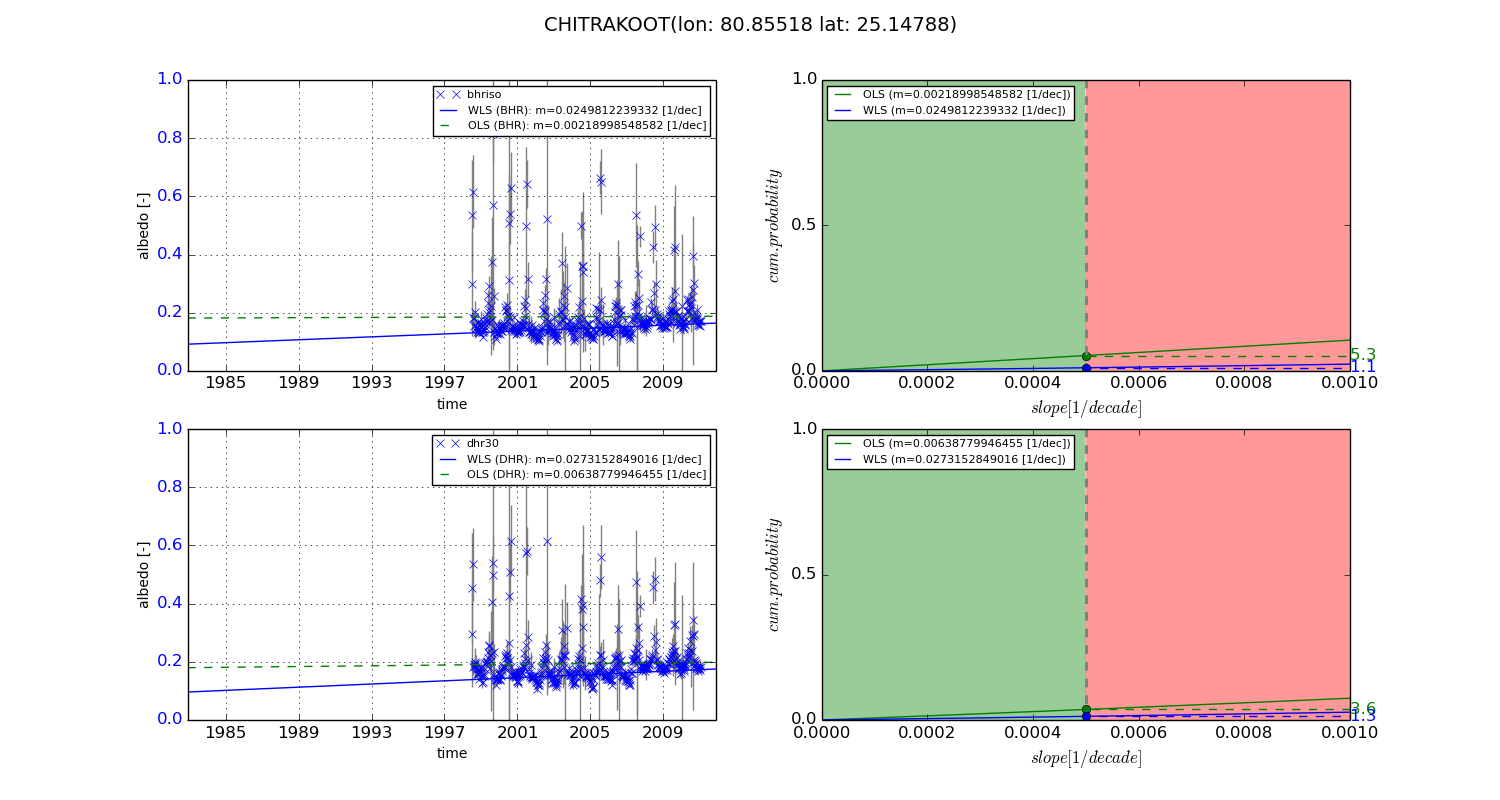
Temporal stability analysis

+000 deg (BHR)


BHR statistics

Temporal stability [1/decade]:


abs

rel


Weighted least square:

None


Ordinary least square:

None


Probabilities that GCOS criteria is met:

Weighted least square:

None %

Ordinary least square:

None %


DHR statistics

Temporal stability [1/decade]:


abs

rel


Weighted least square:

None


Ordinary least square:

None


Probabilities that GCOS criteria is met:

Weighted least square:

None %

Ordinary least square:

None %


+057/+063 deg (BHR)


BHR statistics

Temporal stability [1/decade]:


abs

rel


Weighted least square:

0.0249812239332


Ordinary least square:

0.00218998548582


Probabilities that GCOS criteria is met:

Weighted least square:

1.1 %

Ordinary least square:

5.3 %


DHR statistics

Temporal stability [1/decade]:


abs

rel


Weighted least square:

0.0273152849016


Ordinary least square:

0.00638779946455


Probabilities that GCOS criteria is met:

Weighted least square:

1.3 %

Ordinary least square:

3.6 %


Temporal anomaly analyis

The variance of the temporal anomalies provides an additional measure about the stability of the signal AFTER removal of the mean seasonal cylce.

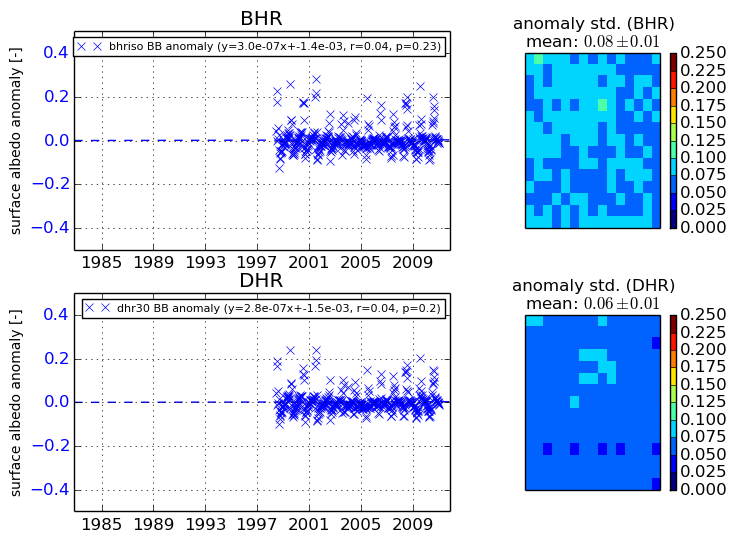
+000 deg


+057/+063 deg