CLERMONT_FERRAND


Location

lon / lat [deg]: 2.9619 / 45.76

Source network: AERONET


Geostationary surface albedo (GSA) data


“+000”


“+057/+063”


Landcover information (based on ESA CCI landcover data)


Landcover fractions @ 2km distance


Landcover fractions @ 20 km distance


Legend


Distance to open water bodies [km]:

8.21

Distance to urban areas [km]:

1.91


Radius: 1 km

Number of landcover classes:

2

Dominant landcover type:

70: Tree cover, needleleaved, evergreen, closed to open (>15%)

Fraction of dominant landcover type [%]:

71.0


Radius: 2 km

Number of landcover classes:

6

Dominant landcover type:

70: Tree cover, needleleaved, evergreen, closed to open (>15%)

Fraction of dominant landcover type [%]:

44.0


Radius: 5 km

Number of landcover classes:

7

Dominant landcover type:

60: Tree cover, broadleaved, decidous

Fraction of dominant landcover type [%]:

39.0


Radius: 10 km

Number of landcover classes:

8

Dominant landcover type:

130: grassland

Fraction of dominant landcover type [%]:

30.0


Radius: 20 km

Number of landcover classes:

8

Dominant landcover type:

130: grassland

Fraction of dominant landcover type [%]:

36.0


Disturbances


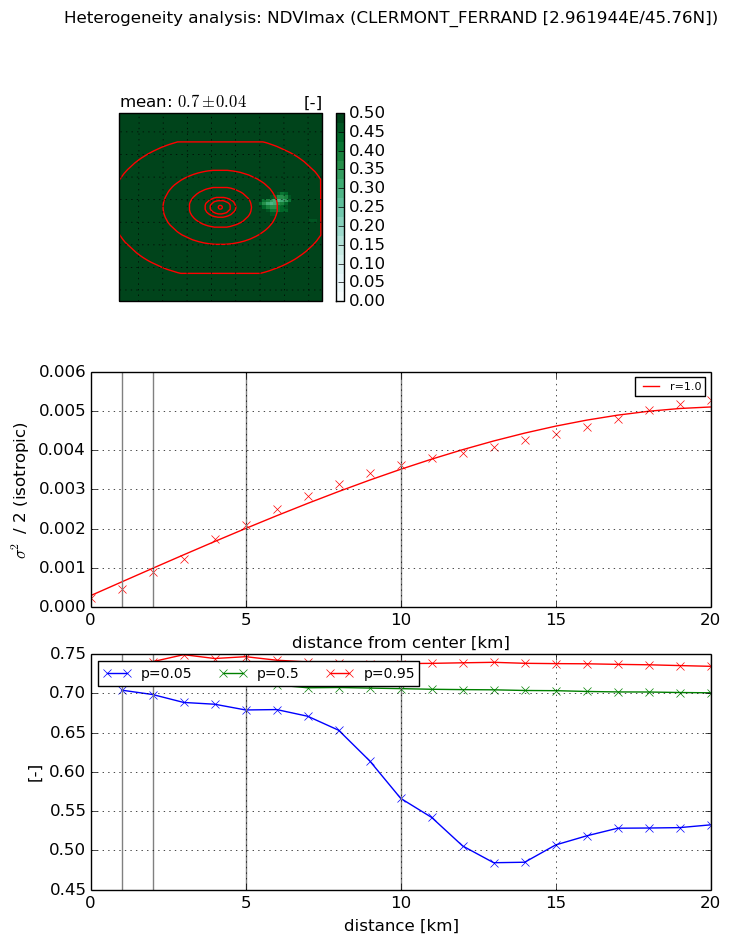
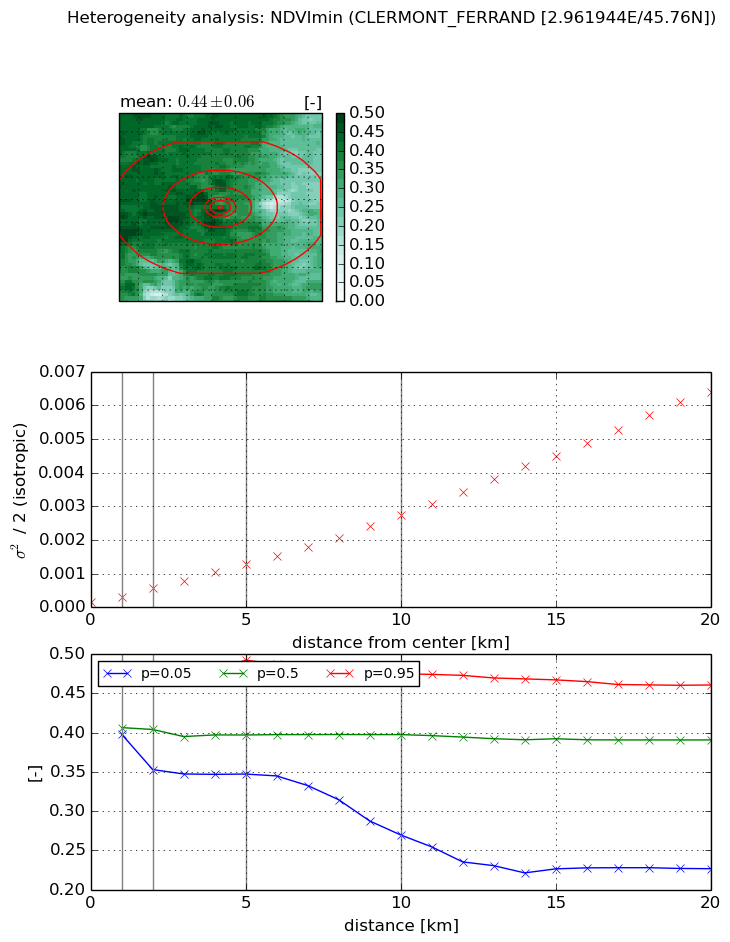
Heterogeneity analysis

The heterogeneity analysis provides information about the spatial and temporal heterogeneity of the site.

Topography


Roman et al. (2009) index


St

nan

Rcv

nan

Rse

nan

Rst

nan

Rsv

nan


Height range @ 1km [m]

184

Height range @ 2km [m]

337

Height range @ 5km [m]

339

Height range @ 10km [m]

-999

Height range @ 20km [m]

-999


Variance slope @ 1 km

3041

Variance slope @ 2 km

3323

Variance slope @ 5 km

3180

Variance slope @ 10 km

-999

Variance slope @ 20 km

-999


NDVI (max. NDVI composite)


Roman et al. (2009) index


St

2.59497317053

Rcv

0.136957519257

Rse

0.0

Rst

-0.0274591074403

Rsv

0.991664690087


NDVI range @ 1km [-]

0.03

NDVI range @ 2km [-]

0.04

NDVI range @ 5km [-]

0.07

NDVI range @ 10km [-]

0.17

NDVI range @ 20km [-]

0.2


Variance slope @ 1 km

0.000246068708199

Variance slope @ 2 km

0.00033492566266

Variance slope @ 5 km

0.000386825476247

Variance slope @ 10 km

0.0003585370994

Variance slope @ 20 km

0.000249816451699


NDVI (min. NDVI composite)I


Roman et al. (2009) index


St

2.19558781827

Rcv

0.110263103254

Rse

0.0

Rst

-0.256113579702

Rsv

-0.999999999877


NDVI range @ 1km [-]

0.07

NDVI range @ 2km [-]

0.12

NDVI range @ 5km [-]

0.15

NDVI range @ 10km [-]

0.21

NDVI range @ 20km [-]

0.23


NDVI slope @ 1 km

0.000159804117714

NDVI slope @ 2 km

0.000216114932987

NDVI slope @ 5 km

0.000230589754568

NDVI slope @ 10 km

0.000256216767437

NDVI slope @ 20 km

0.000320209856402


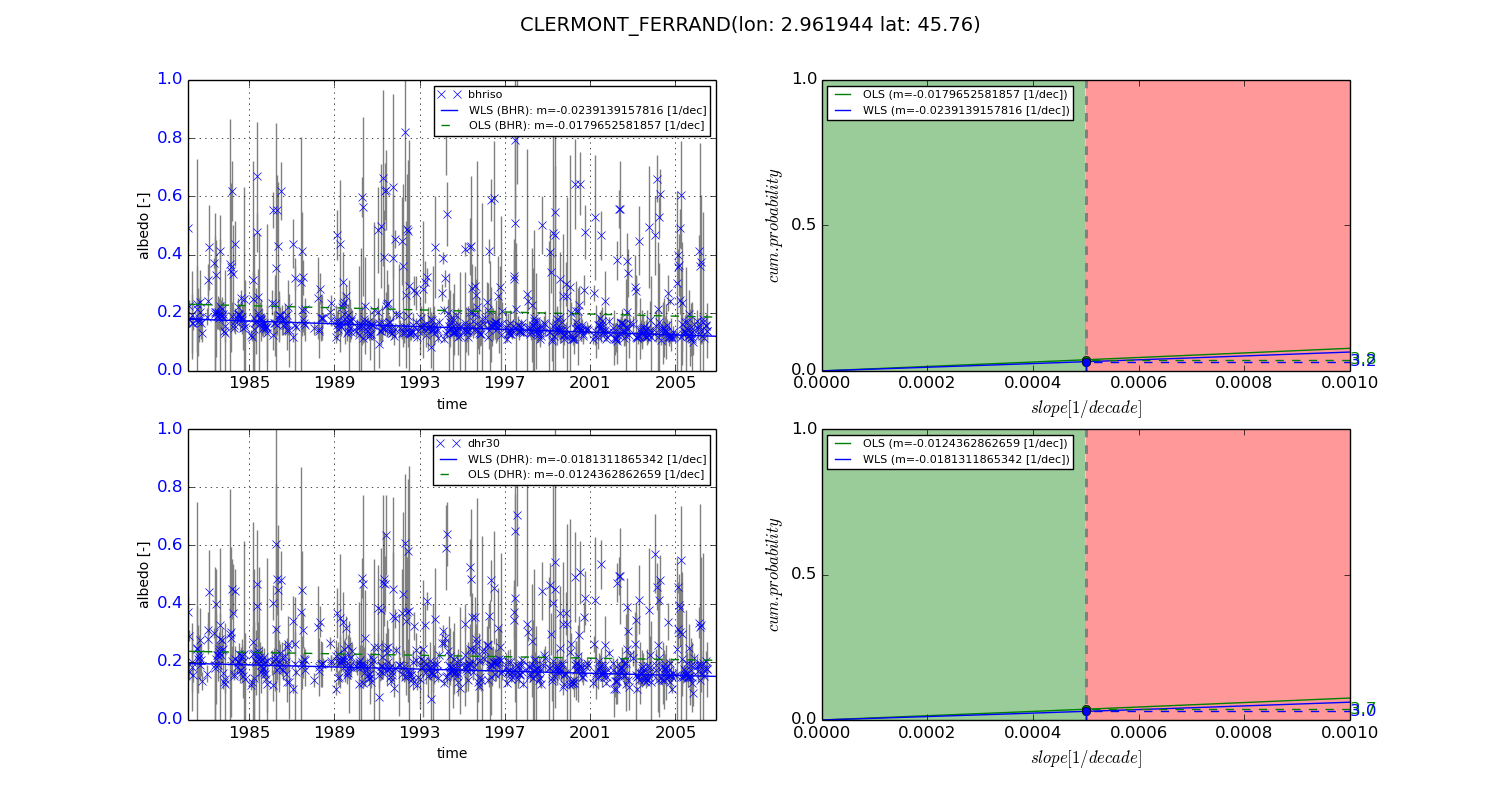
Temporal stability analysis

+000 deg (BHR)


BHR statistics

Temporal stability [1/decade]:


abs

rel


Weighted least square:

-0.0239139157816


Ordinary least square:

-0.0179652581857


Probabilities that GCOS criteria is met:

Weighted least square:

3.2 %

Ordinary least square:

3.8 %


DHR statistics

Temporal stability [1/decade]:


abs

rel


Weighted least square:

-0.0181311865342


Ordinary least square:

-0.0124362862659


Probabilities that GCOS criteria is met:

Weighted least square:

3.0 %

Ordinary least square:

3.7 %


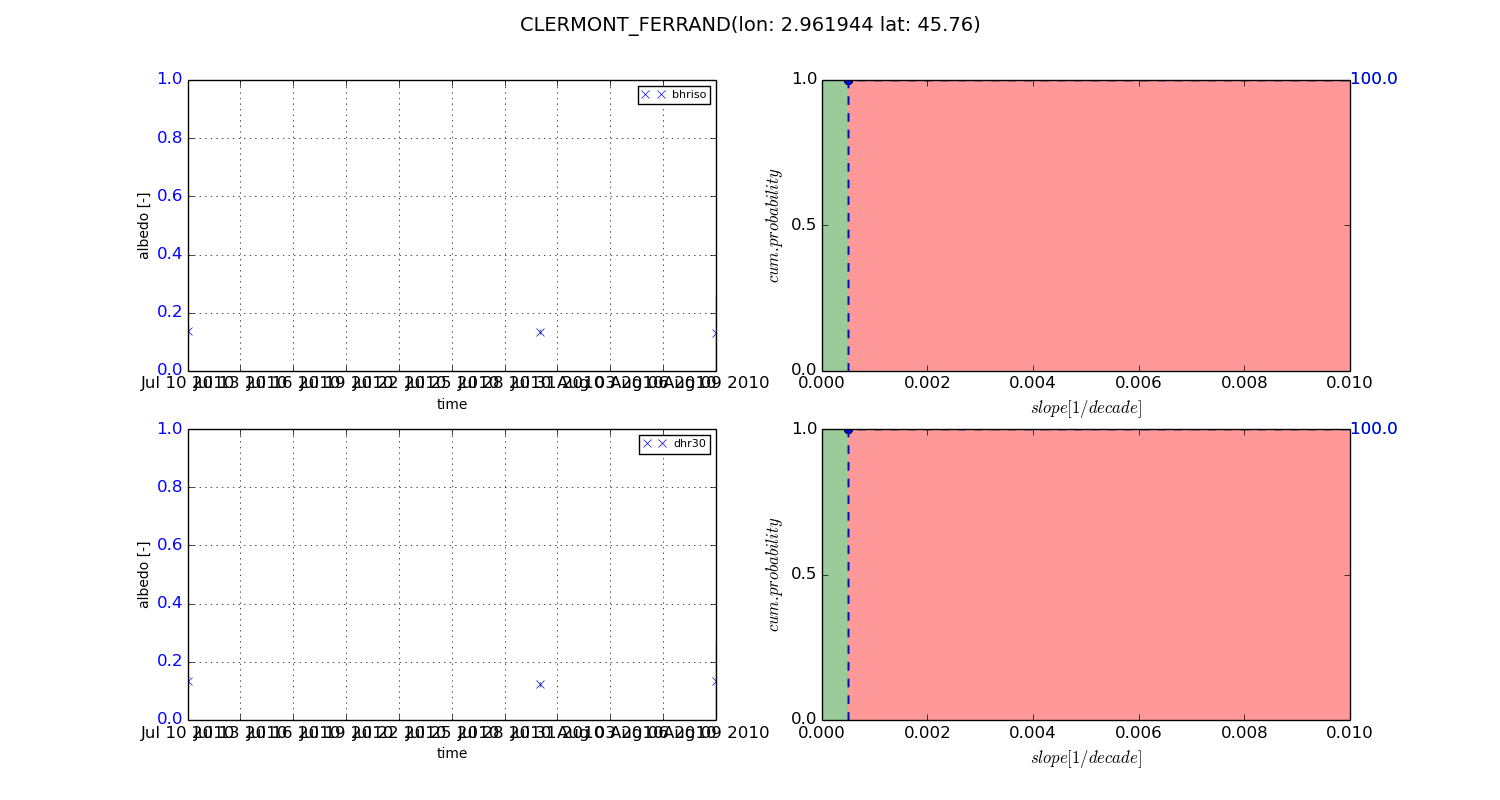
+057/+063 deg (BHR)


BHR statistics

Temporal stability [1/decade]:


abs

rel


Weighted least square:

-99999.0


Ordinary least square:

-99999.0


Probabilities that GCOS criteria is met:

Weighted least square:

-99999.0 %

Ordinary least square:

-99999.0 %


DHR statistics

Temporal stability [1/decade]:


abs

rel


Weighted least square:

-99999.0


Ordinary least square:

-99999.0


Probabilities that GCOS criteria is met:

Weighted least square:

-99999.0 %

Ordinary least square:

-99999.0 %


Temporal anomaly analyis

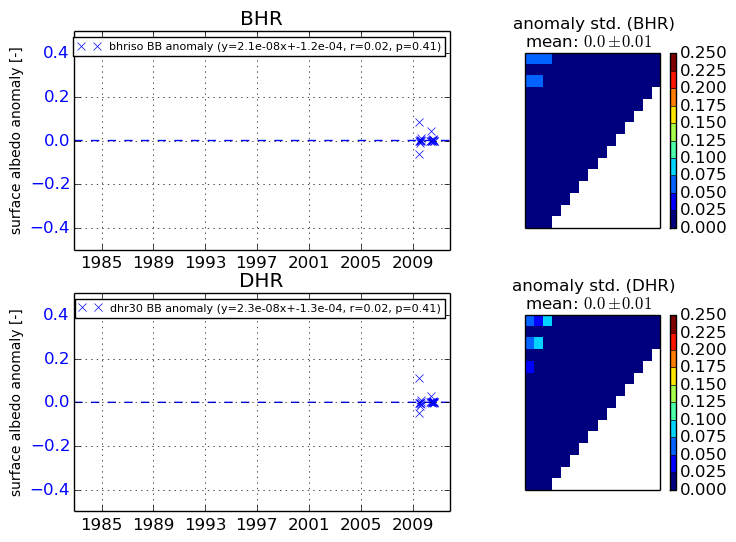
The variance of the temporal anomalies provides an additional measure about the stability of the signal AFTER removal of the mean seasonal cylce.
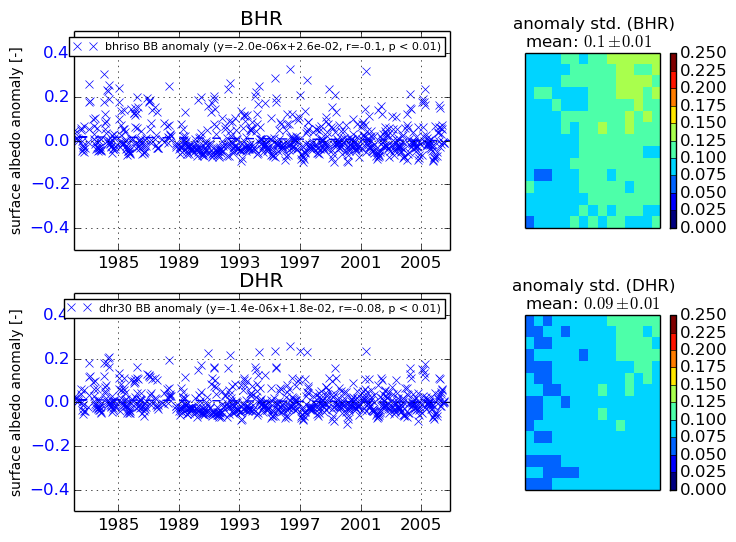
+000 deg


+057/+063 deg