CN-ANH


Location

lon / lat [deg]: 117.0 / 33.0

Source network: FLUXNET


Geostationary surface albedo (GSA) data


“+000”


“+057/+063”


Landcover information (based on ESA CCI landcover data)


Landcover fractions @ 2km distance


Landcover fractions @ 20 km distance


Legend


Distance to open water bodies [km]:

0.78

Distance to urban areas [km]:

4.18


Radius: 1 km

Number of landcover classes:

3

Dominant landcover type:

20: cropland, irrigated or post-flooded

Fraction of dominant landcover type [%]:

50.0


Radius: 2 km

Number of landcover classes:

4

Dominant landcover type:

20: cropland, irrigated or post-flooded

Fraction of dominant landcover type [%]:

56.0


Radius: 5 km

Number of landcover classes:

5

Dominant landcover type:

20: cropland, irrigated or post-flooded

Fraction of dominant landcover type [%]:

44.0


Radius: 10 km

Number of landcover classes:

5

Dominant landcover type:

20: cropland, irrigated or post-flooded

Fraction of dominant landcover type [%]:

38.0


Radius: 20 km

Number of landcover classes:

6

Dominant landcover type:

20: cropland, irrigated or post-flooded

Fraction of dominant landcover type [%]:

34.0


Disturbances


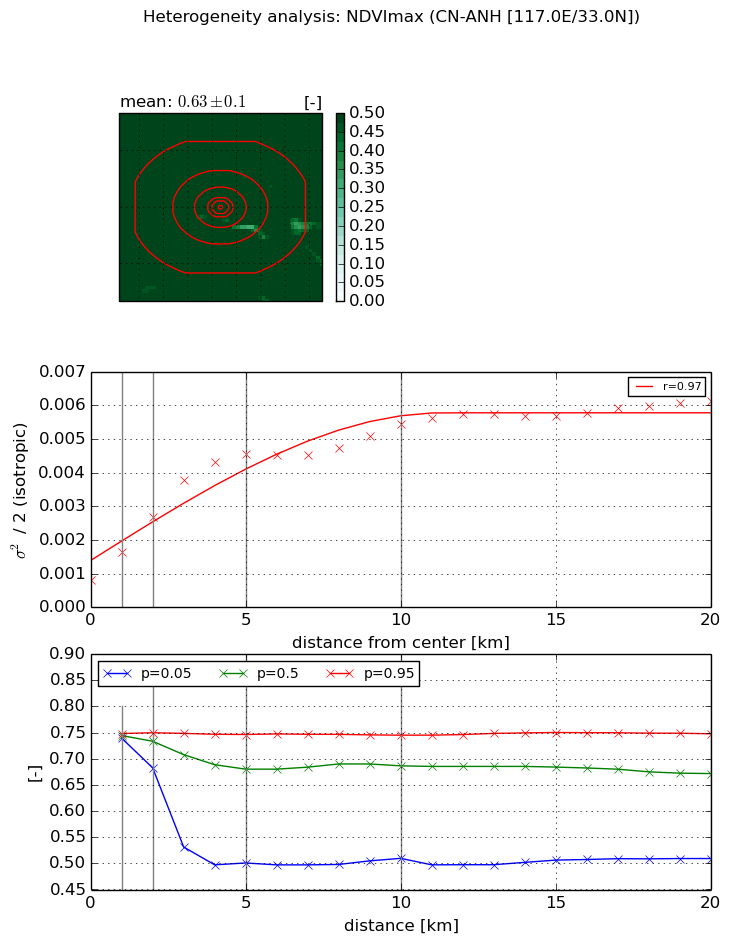
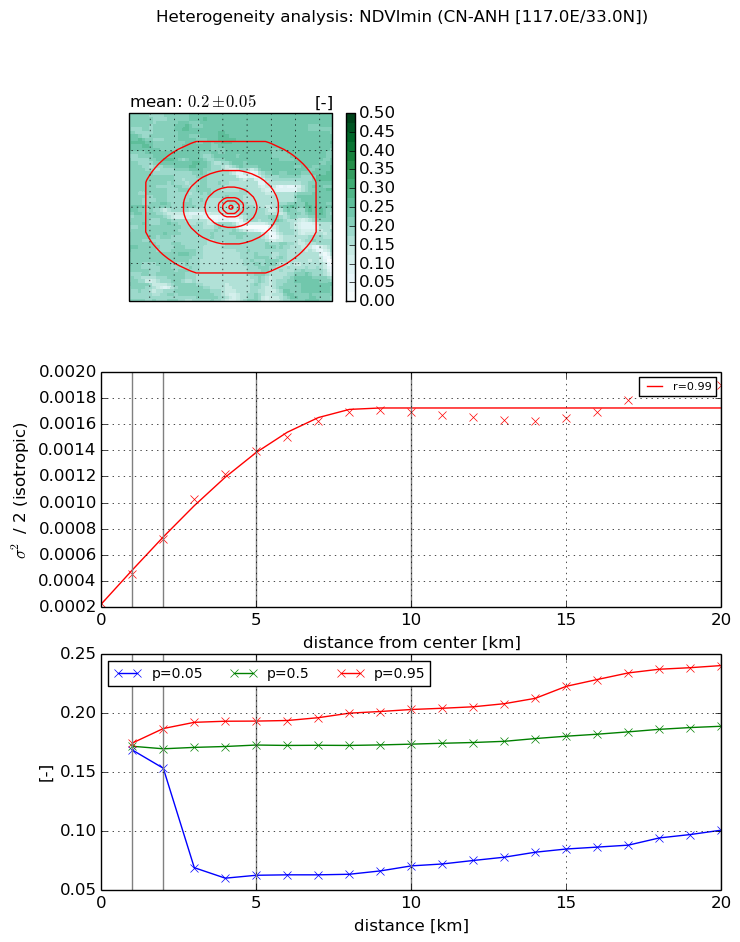
Heterogeneity analysis

The heterogeneity analysis provides information about the spatial and temporal heterogeneity of the site.

Topography


Roman et al. (2009) index


St

1.39402330641e-05

Rcv

0.0980282414801

Rse

0.0

Rst

-0.147340041265

Rsv

215204.191043


Height range @ 1km [m]

4

Height range @ 2km [m]

5

Height range @ 5km [m]

8

Height range @ 10km [m]

-999

Height range @ 20km [m]

-999


Variance slope @ 1 km

3

Variance slope @ 2 km

1

Variance slope @ 5 km

0

Variance slope @ 10 km

-999

Variance slope @ 20 km

-999


NDVI (max. NDVI composite)


Roman et al. (2009) index


St

8.43088985646

Rcv

0.230853922412

Rse

0.0

Rst

0.0521312282636

Rsv

0.0728491741791


NDVI range @ 1km [-]

0.01

NDVI range @ 2km [-]

0.07

NDVI range @ 5km [-]

0.25

NDVI range @ 10km [-]

0.24

NDVI range @ 20km [-]

0.24


Variance slope @ 1 km

0.000834643707517

Variance slope @ 2 km

0.000933978274787

Variance slope @ 5 km

0.000795362360082

Variance slope @ 10 km

0.000407230601995

Variance slope @ 20 km

0.000207770733398


NDVI (min. NDVI composite)I


Roman et al. (2009) index


St

3.99374353897

Rcv

0.235395011351

Rse

0.0

Rst

-0.0665006685316

Rsv

0.449279244277


NDVI range @ 1km [-]

0.01

NDVI range @ 2km [-]

0.03

NDVI range @ 5km [-]

0.13

NDVI range @ 10km [-]

0.13

NDVI range @ 20km [-]

0.14


NDVI slope @ 1 km

0.000221154548276

NDVI slope @ 2 km

0.000246174147778

NDVI slope @ 5 km

0.000241748475818

NDVI slope @ 10 km

0.000152044396978

NDVI slope @ 20 km

6.2642459264e-05


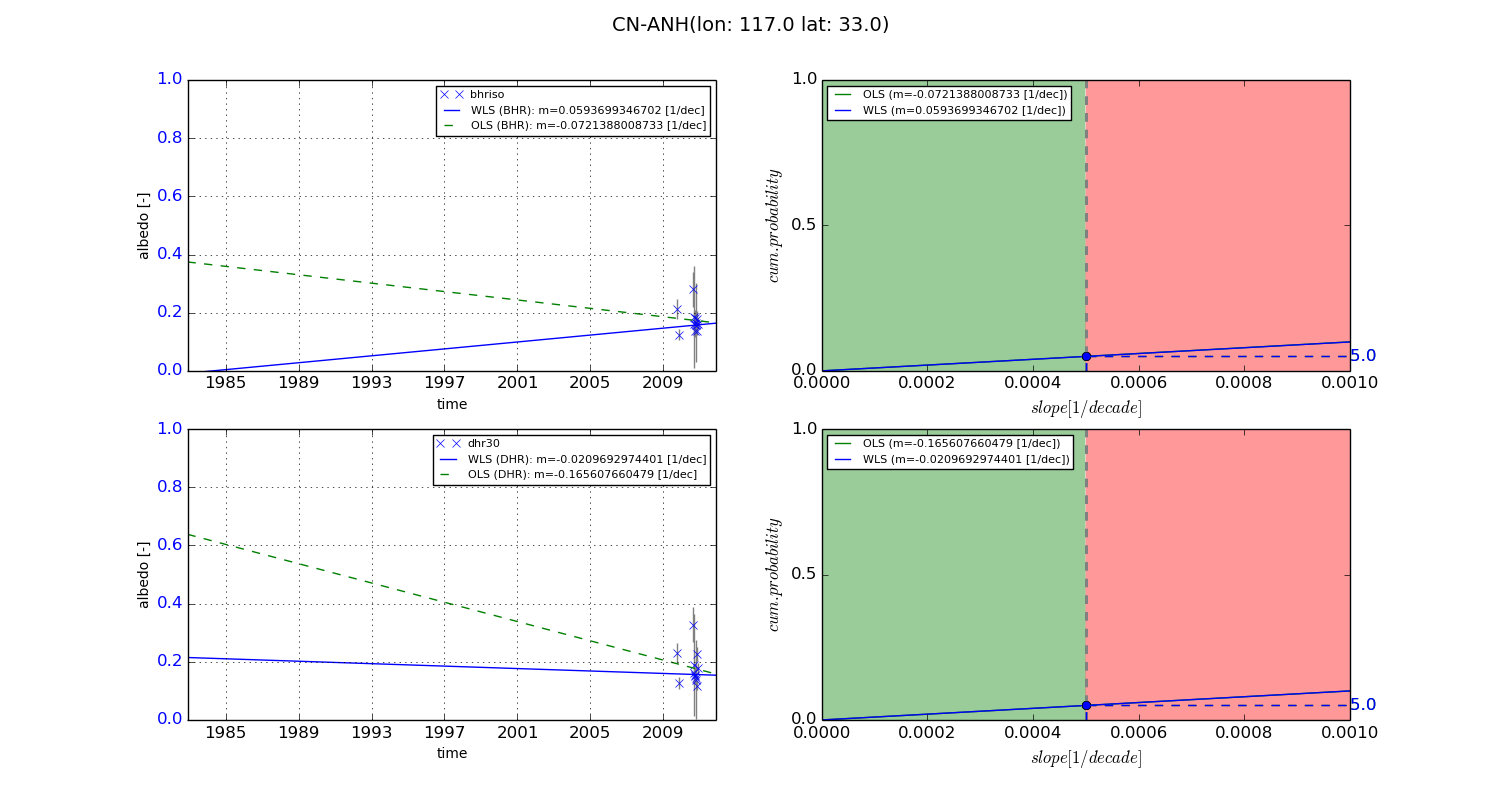
Temporal stability analysis

+000 deg (BHR)


BHR statistics

Temporal stability [1/decade]:


abs

rel


Weighted least square:

None


Ordinary least square:

None


Probabilities that GCOS criteria is met:

Weighted least square:

None %

Ordinary least square:

None %


DHR statistics

Temporal stability [1/decade]:


abs

rel


Weighted least square:

None


Ordinary least square:

None


Probabilities that GCOS criteria is met:

Weighted least square:

None %

Ordinary least square:

None %


+057/+063 deg (BHR)


BHR statistics

Temporal stability [1/decade]:


abs

rel


Weighted least square:

0.0593699346702


Ordinary least square:

-0.0721388008733


Probabilities that GCOS criteria is met:

Weighted least square:

5.0 %

Ordinary least square:

5.0 %


DHR statistics

Temporal stability [1/decade]:


abs

rel


Weighted least square:

-0.0209692974401


Ordinary least square:

-0.165607660479


Probabilities that GCOS criteria is met:

Weighted least square:

5.0 %

Ordinary least square:

5.0 %


Temporal anomaly analyis

The variance of the temporal anomalies provides an additional measure about the stability of the signal AFTER removal of the mean seasonal cylce.

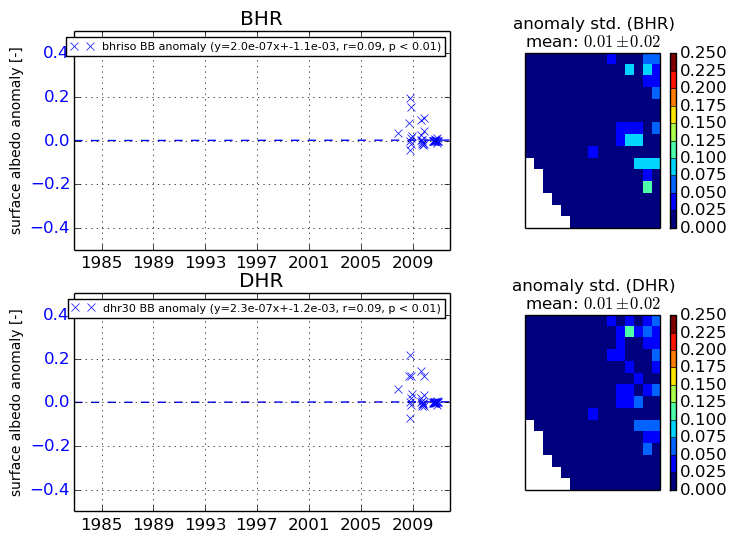
+000 deg


+057/+063 deg