CN-BED


Location

lon / lat [deg]: 116.252 / 39.5306

Source network: FLUXNET


Geostationary surface albedo (GSA) data


“+000”


“+057/+063”


Landcover information (based on ESA CCI landcover data)


Landcover fractions @ 2km distance


Landcover fractions @ 20 km distance


Legend


Distance to open water bodies [km]:

17.28

Distance to urban areas [km]:

2.03


Radius: 1 km

Number of landcover classes:

2

Dominant landcover type:

10: cropland, rainfed

Fraction of dominant landcover type [%]:

78.0


Radius: 2 km

Number of landcover classes:

6

Dominant landcover type:

10: cropland, rainfed

Fraction of dominant landcover type [%]:

73.0


Radius: 5 km

Number of landcover classes:

5

Dominant landcover type:

10: cropland, rainfed

Fraction of dominant landcover type [%]:

75.0


Radius: 10 km

Number of landcover classes:

4

Dominant landcover type:

10: cropland, rainfed

Fraction of dominant landcover type [%]:

75.0


Radius: 20 km

Number of landcover classes:

4

Dominant landcover type:

10: cropland, rainfed

Fraction of dominant landcover type [%]:

72.0


Disturbances


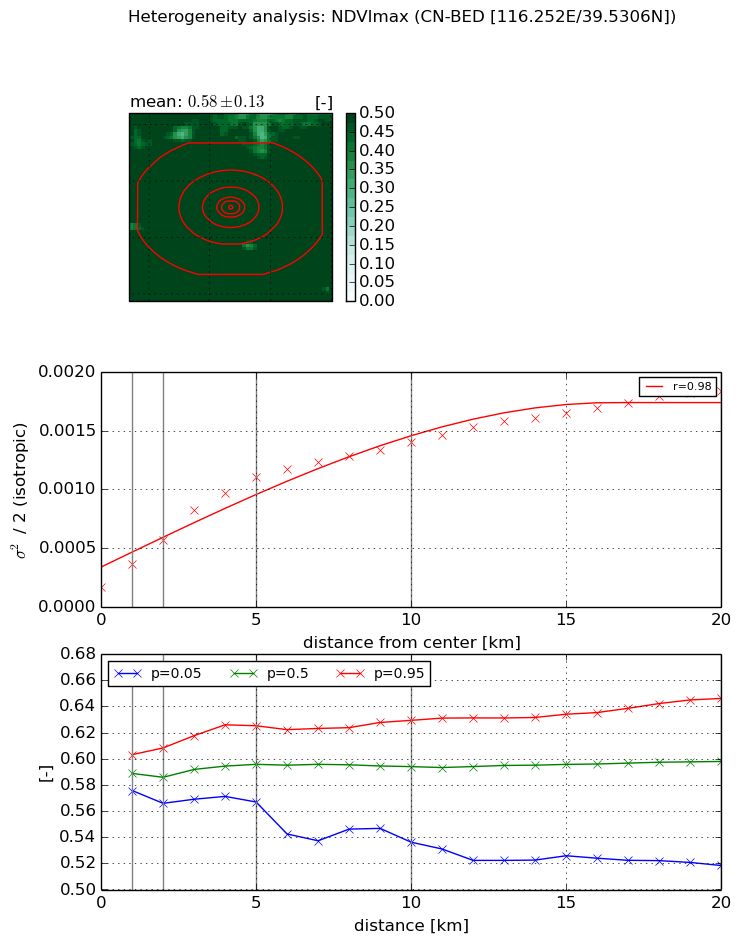
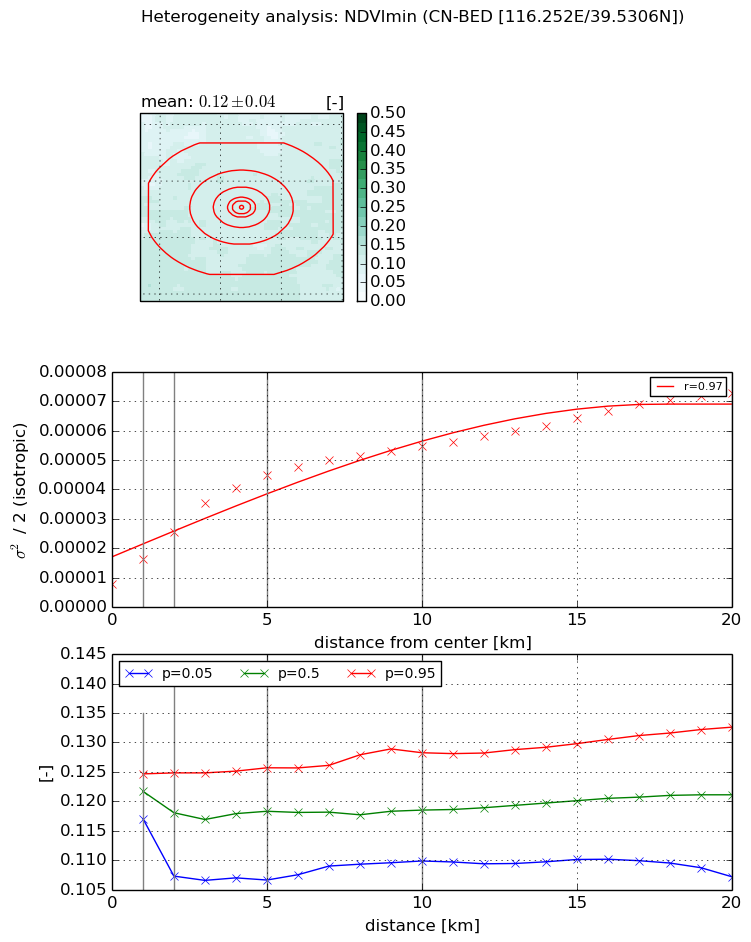
Heterogeneity analysis

The heterogeneity analysis provides information about the spatial and temporal heterogeneity of the site.

Topography


Roman et al. (2009) index


St

1.75945229294

Rcv

0.108549448021

Rse

0.0

Rst

0.0232245549728

Rsv

1.57330206643


Height range @ 1km [m]

7

Height range @ 2km [m]

8

Height range @ 5km [m]

9

Height range @ 10km [m]

-999

Height range @ 20km [m]

-999


Variance slope @ 1 km

2

Variance slope @ 2 km

1

Variance slope @ 5 km

1

Variance slope @ 10 km

-999

Variance slope @ 20 km

-999


NDVI (max. NDVI composite)


Roman et al. (2009) index


St

3.40614227949

Rcv

0.260909838097

Rse

0.0

Rst

-0.145966813459

Rsv

0.473885146935


NDVI range @ 1km [-]

0.03

NDVI range @ 2km [-]

0.04

NDVI range @ 5km [-]

0.06

NDVI range @ 10km [-]

0.09

NDVI range @ 20km [-]

0.13


Variance slope @ 1 km

0.000188881603362

Variance slope @ 2 km

0.000198002725713

Variance slope @ 5 km

0.000192130321165

Variance slope @ 10 km

0.000119914511132

Variance slope @ 20 km

7.30927009635e-05


NDVI (min. NDVI composite)I


Roman et al. (2009) index


St

9.73125539182

Rcv

-0.00163280758491

Rse

0.0

Rst

-0.102871228985

Rsv

0.203780956394


NDVI range @ 1km [-]

0.01

NDVI range @ 2km [-]

0.02

NDVI range @ 5km [-]

0.02

NDVI range @ 10km [-]

0.02

NDVI range @ 20km [-]

0.03


NDVI slope @ 1 km

8.45341649333e-06

NDVI slope @ 2 km

8.7349603438e-06

NDVI slope @ 5 km

7.64035878616e-06

NDVI slope @ 10 km

4.50663044937e-06

NDVI slope @ 20 km

2.72816715898e-06


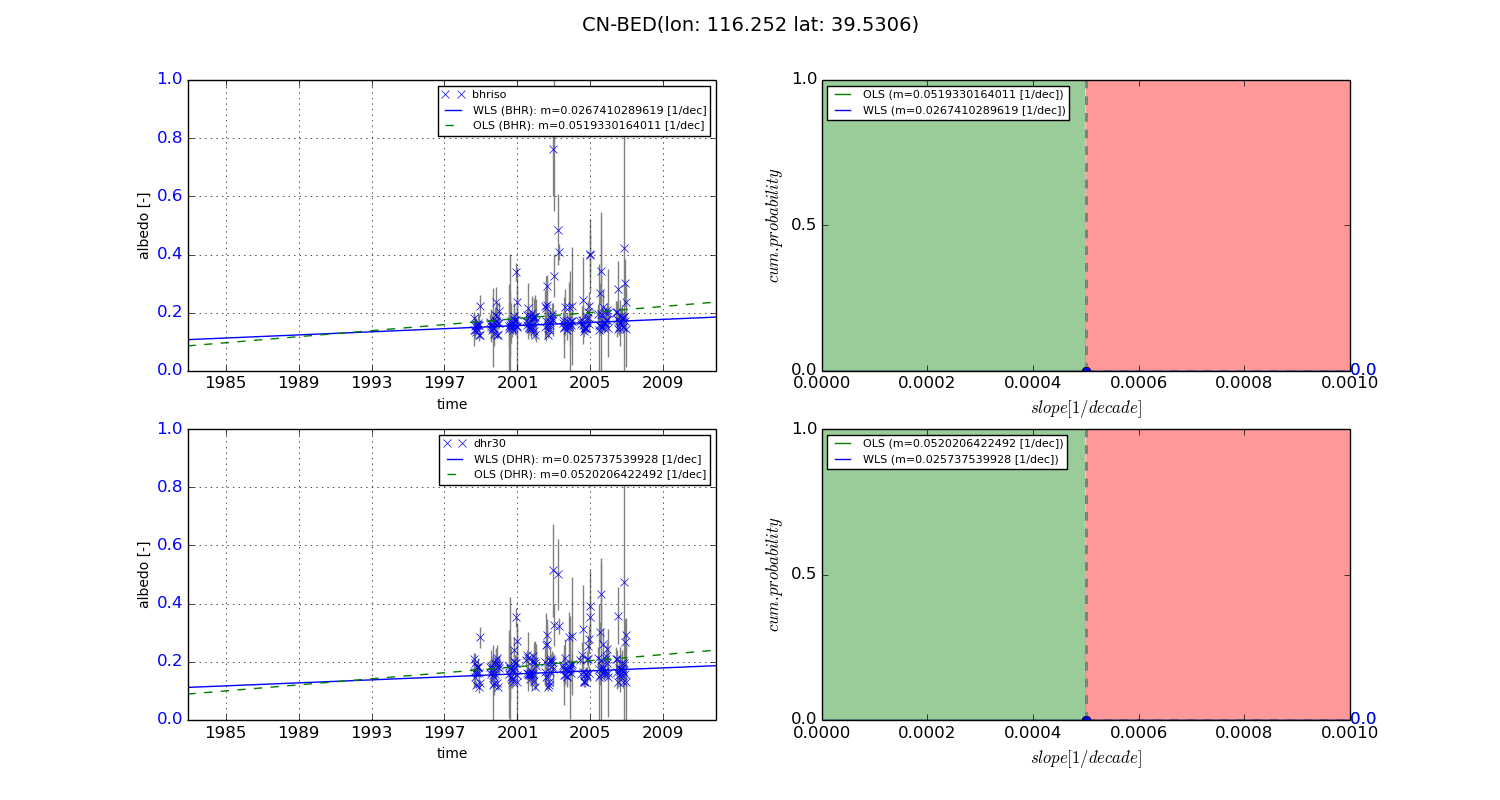
Temporal stability analysis

+000 deg (BHR)


BHR statistics

Temporal stability [1/decade]:


abs

rel


Weighted least square:

None


Ordinary least square:

None


Probabilities that GCOS criteria is met:

Weighted least square:

None %

Ordinary least square:

None %


DHR statistics

Temporal stability [1/decade]:


abs

rel


Weighted least square:

None


Ordinary least square:

None


Probabilities that GCOS criteria is met:

Weighted least square:

None %

Ordinary least square:

None %


+057/+063 deg (BHR)


BHR statistics

Temporal stability [1/decade]:


abs

rel


Weighted least square:

0.0267410289619


Ordinary least square:

0.0519330164011


Probabilities that GCOS criteria is met:

Weighted least square:

0.0 %

Ordinary least square:

0.0 %


DHR statistics

Temporal stability [1/decade]:


abs

rel


Weighted least square:

0.025737539928


Ordinary least square:

0.0520206422492


Probabilities that GCOS criteria is met:

Weighted least square:

0.0 %

Ordinary least square:

0.0 %


Temporal anomaly analyis

The variance of the temporal anomalies provides an additional measure about the stability of the signal AFTER removal of the mean seasonal cylce.

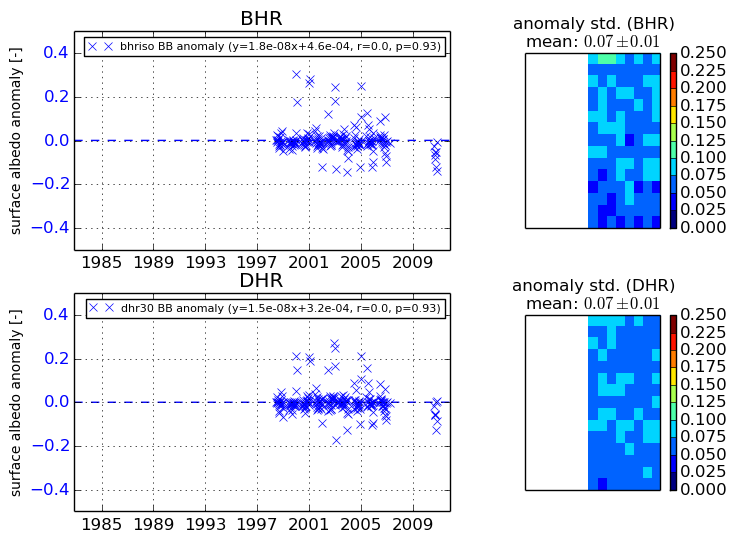
+000 deg


+057/+063 deg