CN-CHA


Location

lon / lat [deg]: 128.096 / 42.4025

Source network: FLUXNET


Geostationary surface albedo (GSA) data


“+000”


“+057/+063”


Landcover information (based on ESA CCI landcover data)


Landcover fractions @ 2km distance


Landcover fractions @ 20 km distance


Legend


Distance to open water bodies [km]:

2.07

Distance to urban areas [km]:

1.23


Radius: 1 km

Number of landcover classes:

3

Dominant landcover type:

60: Tree cover, broadleaved, decidous

Fraction of dominant landcover type [%]:

71.0


Radius: 2 km

Number of landcover classes:

5

Dominant landcover type:

60: Tree cover, broadleaved, decidous

Fraction of dominant landcover type [%]:

78.0


Radius: 5 km

Number of landcover classes:

5

Dominant landcover type:

60: Tree cover, broadleaved, decidous

Fraction of dominant landcover type [%]:

73.0


Radius: 10 km

Number of landcover classes:

5

Dominant landcover type:

60: Tree cover, broadleaved, decidous

Fraction of dominant landcover type [%]:

75.0


Radius: 20 km

Number of landcover classes:

5

Dominant landcover type:

60: Tree cover, broadleaved, decidous

Fraction of dominant landcover type [%]:

77.0


Disturbances


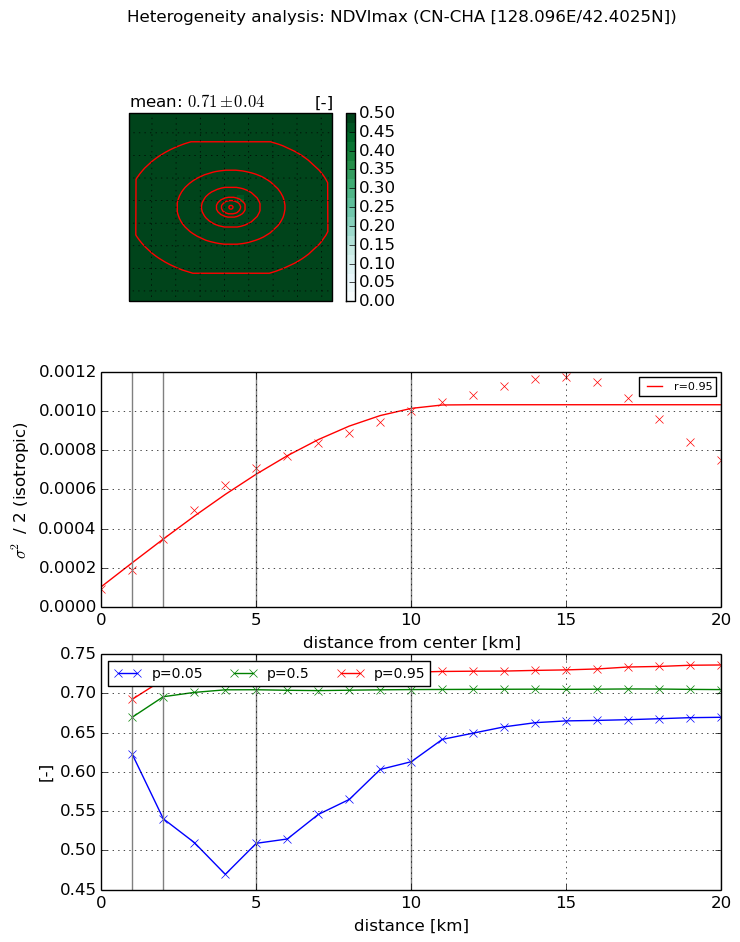
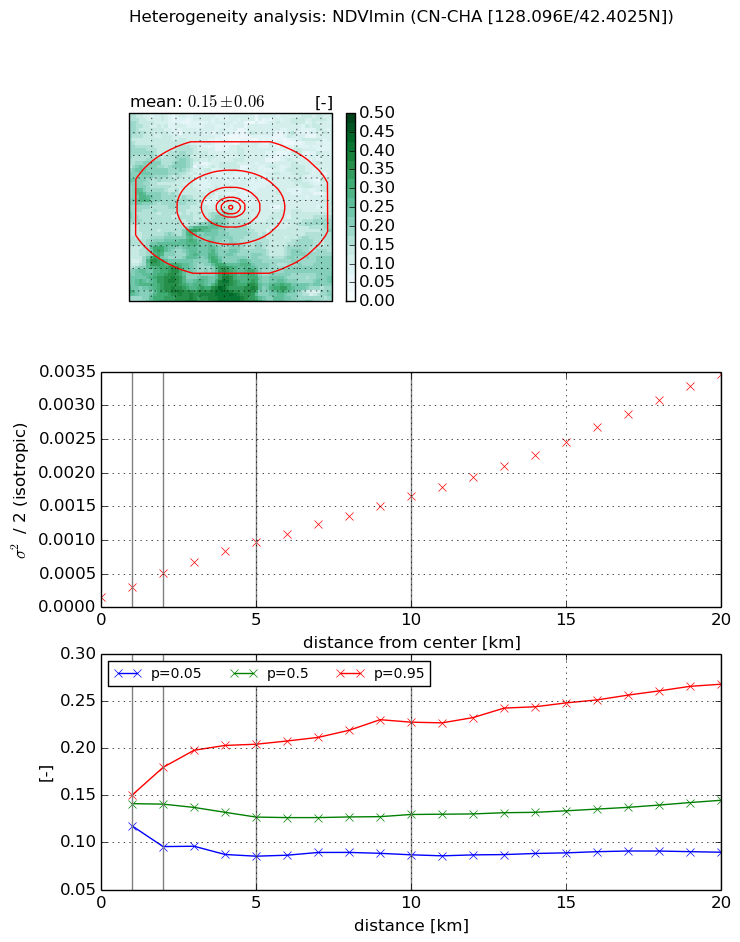
Heterogeneity analysis

The heterogeneity analysis provides information about the spatial and temporal heterogeneity of the site.

Topography


Roman et al. (2009) index


St

4.73029136415

Rcv

0.30550991162

Rse

0.0

Rst

2.05614527861e-07

Rsv

-0.32870028738


Height range @ 1km [m]

49

Height range @ 2km [m]

68

Height range @ 5km [m]

98

Height range @ 10km [m]

-999

Height range @ 20km [m]

-999


Variance slope @ 1 km

109

Variance slope @ 2 km

115

Variance slope @ 5 km

186

Variance slope @ 10 km

-999

Variance slope @ 20 km

-999


NDVI (max. NDVI composite)


Roman et al. (2009) index


St

9.8881594517

Rcv

0.0360766409239

Rse

0.0

Rst

-0.0943648226434

Rsv

0.172951702234


NDVI range @ 1km [-]

0.07

NDVI range @ 2km [-]

0.18

NDVI range @ 5km [-]

0.21

NDVI range @ 10km [-]

0.11

NDVI range @ 20km [-]

0.07


Variance slope @ 1 km

9.88446138055e-05

Variance slope @ 2 km

0.000126795700096

Variance slope @ 5 km

0.000129848775139

Variance slope @ 10 km

9.10974576864e-05

Variance slope @ 20 km

3.86303527624e-05


NDVI (min. NDVI composite)I


Roman et al. (2009) index


St

2.93418388621

Rcv

0.184928267598

Rse

0.0

Rst

-0.117552075869

Rsv

0.719950463988


NDVI range @ 1km [-]

0.03

NDVI range @ 2km [-]

0.08

NDVI range @ 5km [-]

0.12

NDVI range @ 10km [-]

0.14

NDVI range @ 20km [-]

0.18


NDVI slope @ 1 km

0.000143667293458

NDVI slope @ 2 km

0.000171376714528

NDVI slope @ 5 km

0.000166242227613

NDVI slope @ 10 km

0.000147568206808

NDVI slope @ 20 km

0.000159999443289


Temporal stability analysis

+000 deg (BHR)


BHR statistics

Temporal stability [1/decade]:


abs

rel


Weighted least square:

None


Ordinary least square:

None


Probabilities that GCOS criteria is met:

Weighted least square:

None %

Ordinary least square:

None %


DHR statistics

Temporal stability [1/decade]:


abs

rel


Weighted least square:

None


Ordinary least square:

None


Probabilities that GCOS criteria is met:

Weighted least square:

None %

Ordinary least square:

None %


+057/+063 deg (BHR)


BHR statistics

Temporal stability [1/decade]:


abs

rel


Weighted least square:

-99999.0


Ordinary least square:

-99999.0


Probabilities that GCOS criteria is met:

Weighted least square:

-99999.0 %

Ordinary least square:

-99999.0 %


DHR statistics

Temporal stability [1/decade]:


abs

rel


Weighted least square:

-99999.0


Ordinary least square:

-99999.0


Probabilities that GCOS criteria is met:

Weighted least square:

-99999.0 %

Ordinary least square:

-99999.0 %


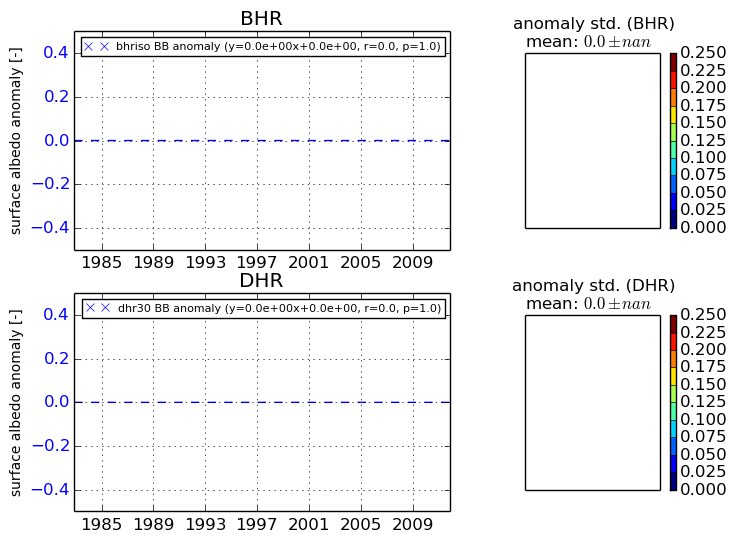
Temporal anomaly analyis

The variance of the temporal anomalies provides an additional measure about the stability of the signal AFTER removal of the mean seasonal cylce.

+000 deg


+057/+063 deg