CN-DU1


Location

lon / lat [deg]: 116.671 / 42.0456

Source network: FLUXNET


Geostationary surface albedo (GSA) data


“+000”


“+057/+063”


Landcover information (based on ESA CCI landcover data)


Landcover fractions @ 2km distance


Landcover fractions @ 20 km distance


Legend


Distance to open water bodies [km]:

4.63

Distance to urban areas [km]:

20.53


Radius: 1 km

Number of landcover classes:

4

Dominant landcover type:

30: mosaic cropland (>50%), natural veg. (< 50%)

Fraction of dominant landcover type [%]:

55.0


Radius: 2 km

Number of landcover classes:

4

Dominant landcover type:

130: grassland

Fraction of dominant landcover type [%]:

33.0


Radius: 5 km

Number of landcover classes:

4

Dominant landcover type:

130: grassland

Fraction of dominant landcover type [%]:

42.0


Radius: 10 km

Number of landcover classes:

5

Dominant landcover type:

130: grassland

Fraction of dominant landcover type [%]:

48.0


Radius: 20 km

Number of landcover classes:

6

Dominant landcover type:

130: grassland

Fraction of dominant landcover type [%]:

44.0


Disturbances


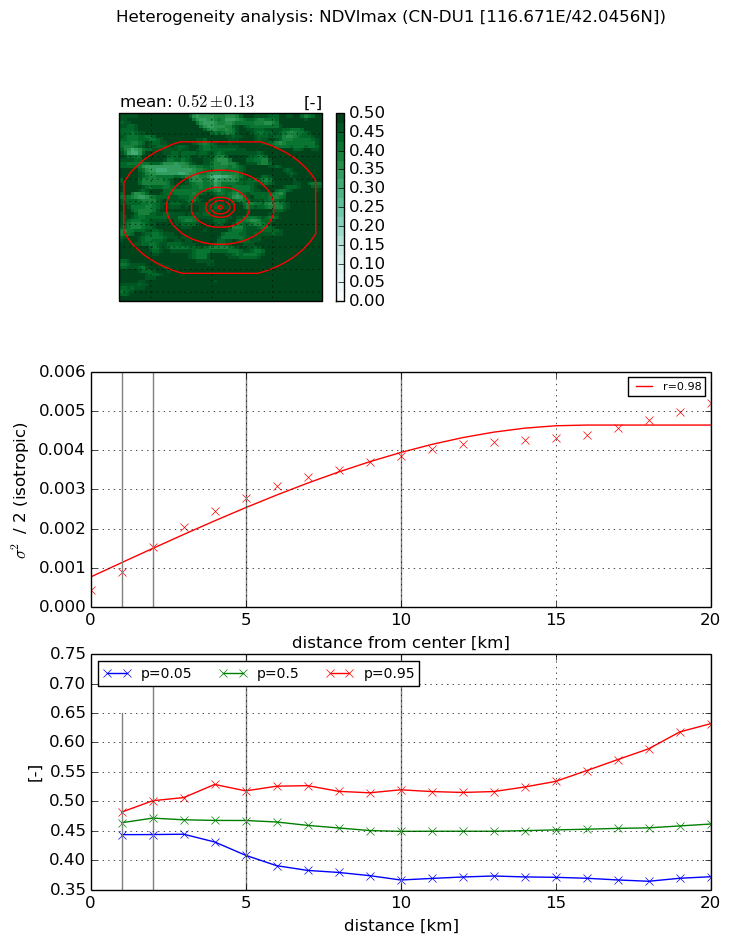
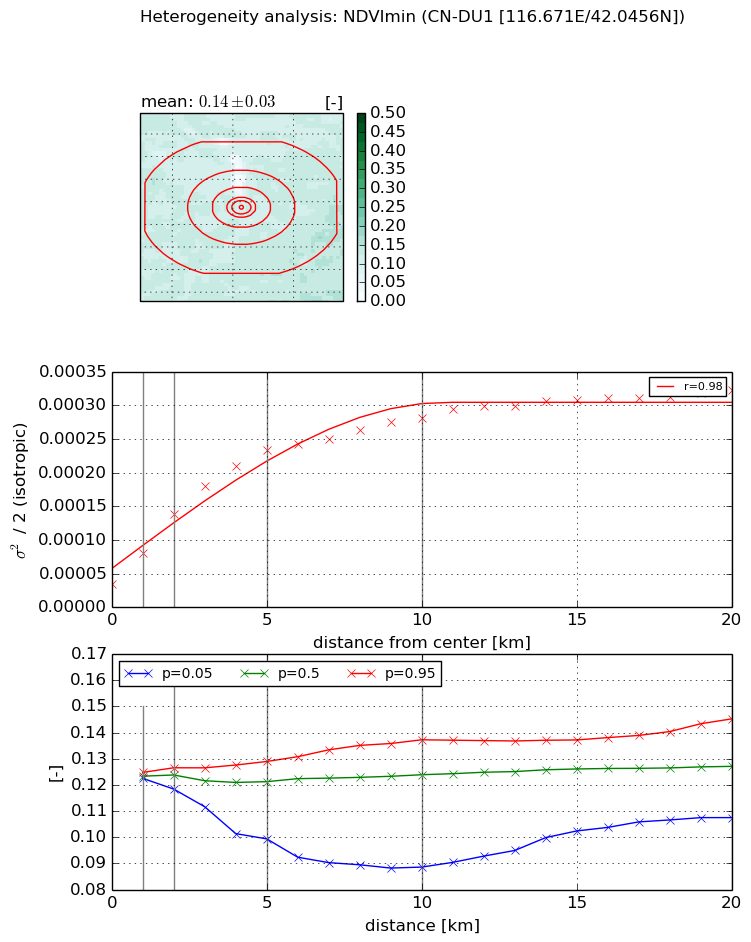
Heterogeneity analysis

The heterogeneity analysis provides information about the spatial and temporal heterogeneity of the site.

Topography


Roman et al. (2009) index


St

4.31943257091

Rcv

0.350248422296

Rse

0.0

Rst

-0.00267181019373

Rsv

-0.341615438748


Height range @ 1km [m]

107

Height range @ 2km [m]

151

Height range @ 5km [m]

187

Height range @ 10km [m]

-999

Height range @ 20km [m]

-999


Variance slope @ 1 km

1250

Variance slope @ 2 km

1014

Variance slope @ 5 km

737

Variance slope @ 10 km

-999

Variance slope @ 20 km

-999


NDVI (max. NDVI composite)


Roman et al. (2009) index


St

1.49114686064

Rcv

0.82159042015

Rse

0.0

Rst

-0.190284029204

Rsv

-0.9999998195


NDVI range @ 1km [-]

0.04

NDVI range @ 2km [-]

0.06

NDVI range @ 5km [-]

0.11

NDVI range @ 10km [-]

0.15

NDVI range @ 20km [-]

0.26


Variance slope @ 1 km

0.000465484011731

Variance slope @ 2 km

0.000545631044519

Variance slope @ 5 km

0.000482300386815

Variance slope @ 10 km

0.000339935911099

Variance slope @ 20 km

0.000203256259287


NDVI (min. NDVI composite)I


Roman et al. (2009) index


St

0.767088442775

Rcv

1.80738890235

Rse

0.0

Rst

-0.209191164555

Rsv

1.89431186251


NDVI range @ 1km [-]

0.0

NDVI range @ 2km [-]

0.01

NDVI range @ 5km [-]

0.03

NDVI range @ 10km [-]

0.05

NDVI range @ 20km [-]

0.04


NDVI slope @ 1 km

4.58094661644e-05

NDVI slope @ 2 km

5.18443716321e-05

NDVI slope @ 5 km

4.07775436125e-05

NDVI slope @ 10 km

2.33247389161e-05

NDVI slope @ 20 km

1.14478804235e-05


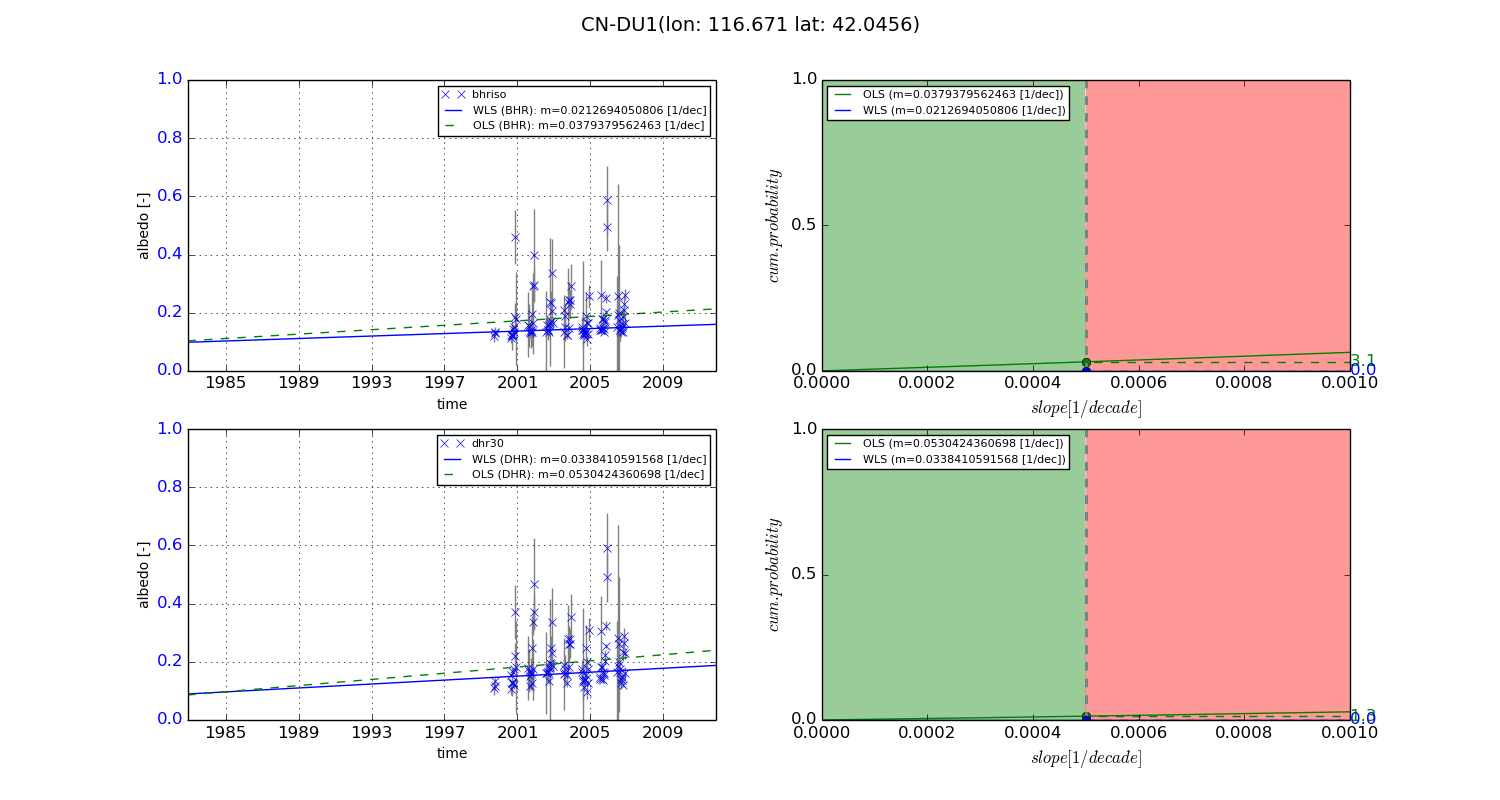
Temporal stability analysis

+000 deg (BHR)


BHR statistics

Temporal stability [1/decade]:


abs

rel


Weighted least square:

None


Ordinary least square:

None


Probabilities that GCOS criteria is met:

Weighted least square:

None %

Ordinary least square:

None %


DHR statistics

Temporal stability [1/decade]:


abs

rel


Weighted least square:

None


Ordinary least square:

None


Probabilities that GCOS criteria is met:

Weighted least square:

None %

Ordinary least square:

None %


+057/+063 deg (BHR)


BHR statistics

Temporal stability [1/decade]:


abs

rel


Weighted least square:

0.0212694050806


Ordinary least square:

0.0379379562463


Probabilities that GCOS criteria is met:

Weighted least square:

0.0 %

Ordinary least square:

3.1 %


DHR statistics

Temporal stability [1/decade]:


abs

rel


Weighted least square:

0.0338410591568


Ordinary least square:

0.0530424360698


Probabilities that GCOS criteria is met:

Weighted least square:

0.0 %

Ordinary least square:

1.3 %


Temporal anomaly analyis

The variance of the temporal anomalies provides an additional measure about the stability of the signal AFTER removal of the mean seasonal cylce.

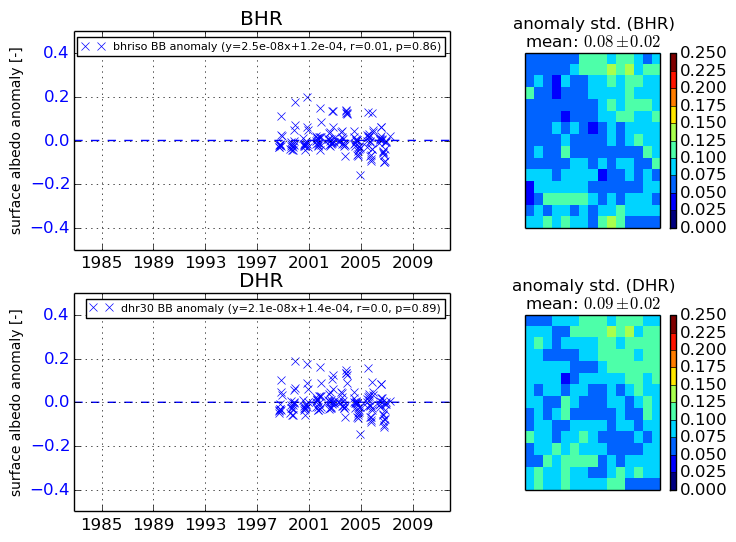
+000 deg


+057/+063 deg