CN-DU2


Location

lon / lat [deg]: 116.284 / 42.0467

Source network: FLUXNET


Geostationary surface albedo (GSA) data


“+000”


“+057/+063”


Landcover information (based on ESA CCI landcover data)


Landcover fractions @ 2km distance


Landcover fractions @ 20 km distance


Legend


Distance to open water bodies [km]:

9.96

Distance to urban areas [km]:

21.55


Radius: 1 km

Number of landcover classes:

3

Dominant landcover type:

130: grassland

Fraction of dominant landcover type [%]:

53.0


Radius: 2 km

Number of landcover classes:

4

Dominant landcover type:

130: grassland

Fraction of dominant landcover type [%]:

69.0


Radius: 5 km

Number of landcover classes:

5

Dominant landcover type:

130: grassland

Fraction of dominant landcover type [%]:

64.0


Radius: 10 km

Number of landcover classes:

5

Dominant landcover type:

130: grassland

Fraction of dominant landcover type [%]:

63.0


Radius: 20 km

Number of landcover classes:

5

Dominant landcover type:

130: grassland

Fraction of dominant landcover type [%]:

58.0


Disturbances


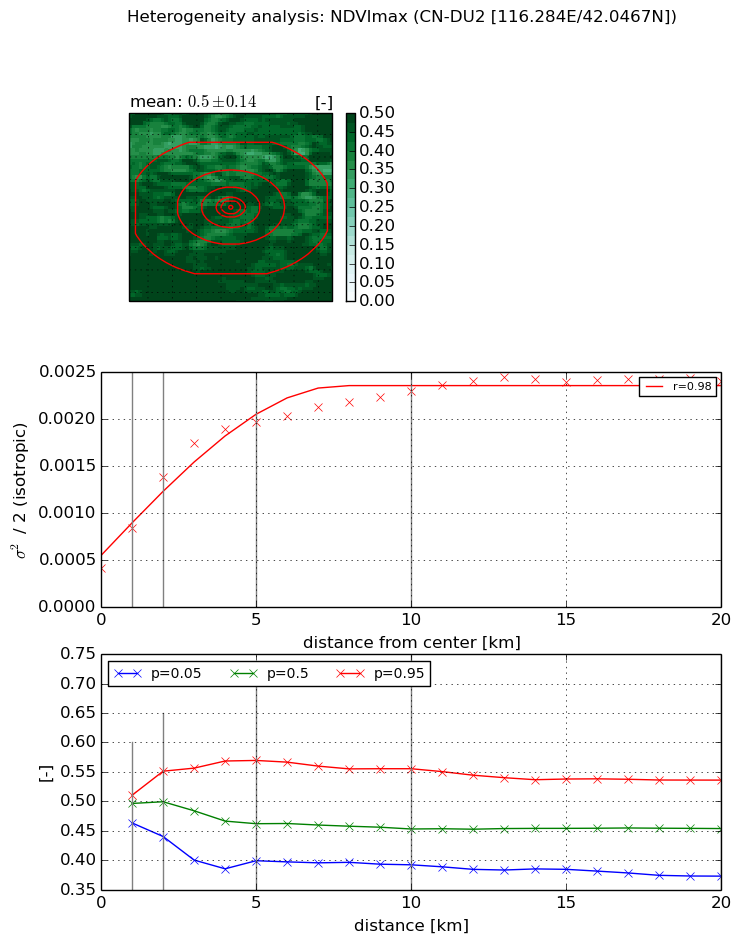
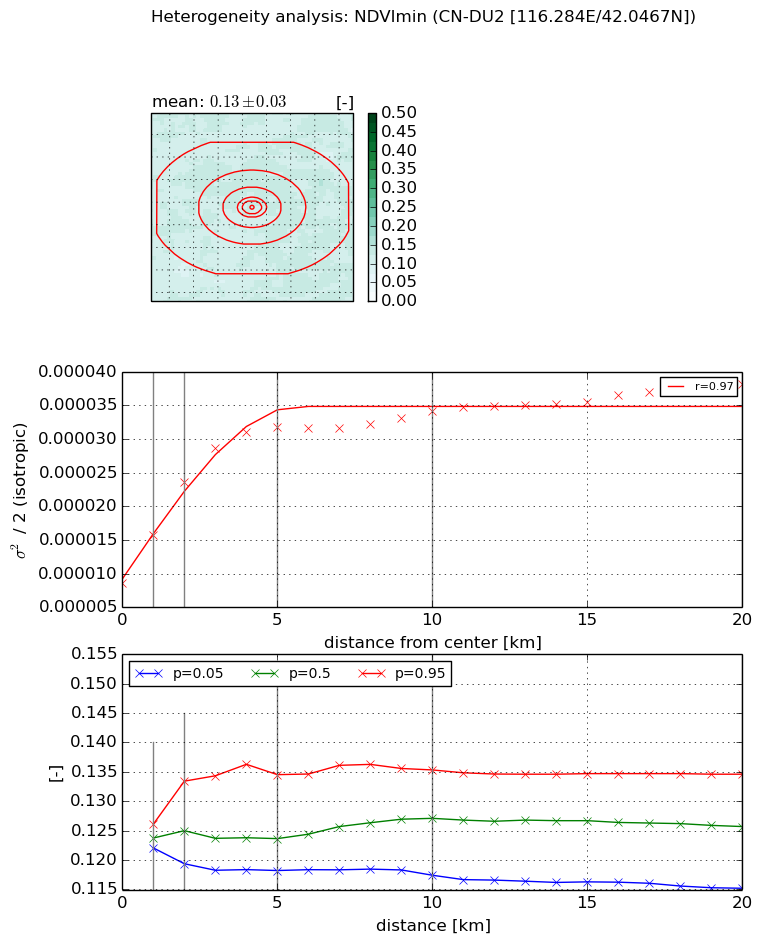
Heterogeneity analysis

The heterogeneity analysis provides information about the spatial and temporal heterogeneity of the site.

Topography


Roman et al. (2009) index


St

7.56002062354e-05

Rcv

0.853142626501

Rse

0.0

Rst

0.00747467921001

Rsv

39681.5708123


Height range @ 1km [m]

16

Height range @ 2km [m]

31

Height range @ 5km [m]

131

Height range @ 10km [m]

-999

Height range @ 20km [m]

-999


Variance slope @ 1 km

438

Variance slope @ 2 km

394

Variance slope @ 5 km

389

Variance slope @ 10 km

-999

Variance slope @ 20 km

-999


NDVI (max. NDVI composite)


Roman et al. (2009) index


St

5.11121593933

Rcv

0.115660372513

Rse

0.0

Rst

-0.127473691511

Rsv

0.34381041956


NDVI range @ 1km [-]

0.05

NDVI range @ 2km [-]

0.11

NDVI range @ 5km [-]

0.17

NDVI range @ 10km [-]

0.16

NDVI range @ 20km [-]

0.16


Variance slope @ 1 km

0.000425297845489

Variance slope @ 2 km

0.000480615216828

Variance slope @ 5 km

0.000322418469225

Variance slope @ 10 km

0.000166168476089

Variance slope @ 20 km

7.22120736262e-05


NDVI (min. NDVI composite)I


Roman et al. (2009) index


St

14.1148451745

Rcv

-0.0322718800126

Rse

0.0

Rst

-0.0984914872739

Rsv

0.0817788152823


NDVI range @ 1km [-]

0.0

NDVI range @ 2km [-]

0.01

NDVI range @ 5km [-]

0.02

NDVI range @ 10km [-]

0.02

NDVI range @ 20km [-]

0.02


NDVI slope @ 1 km

7.13988024621e-06

NDVI slope @ 2 km

7.5471965099e-06

NDVI slope @ 5 km

4.78214231828e-06

NDVI slope @ 10 km

2.09175084469e-06

NDVI slope @ 20 km

9.61951957011e-07


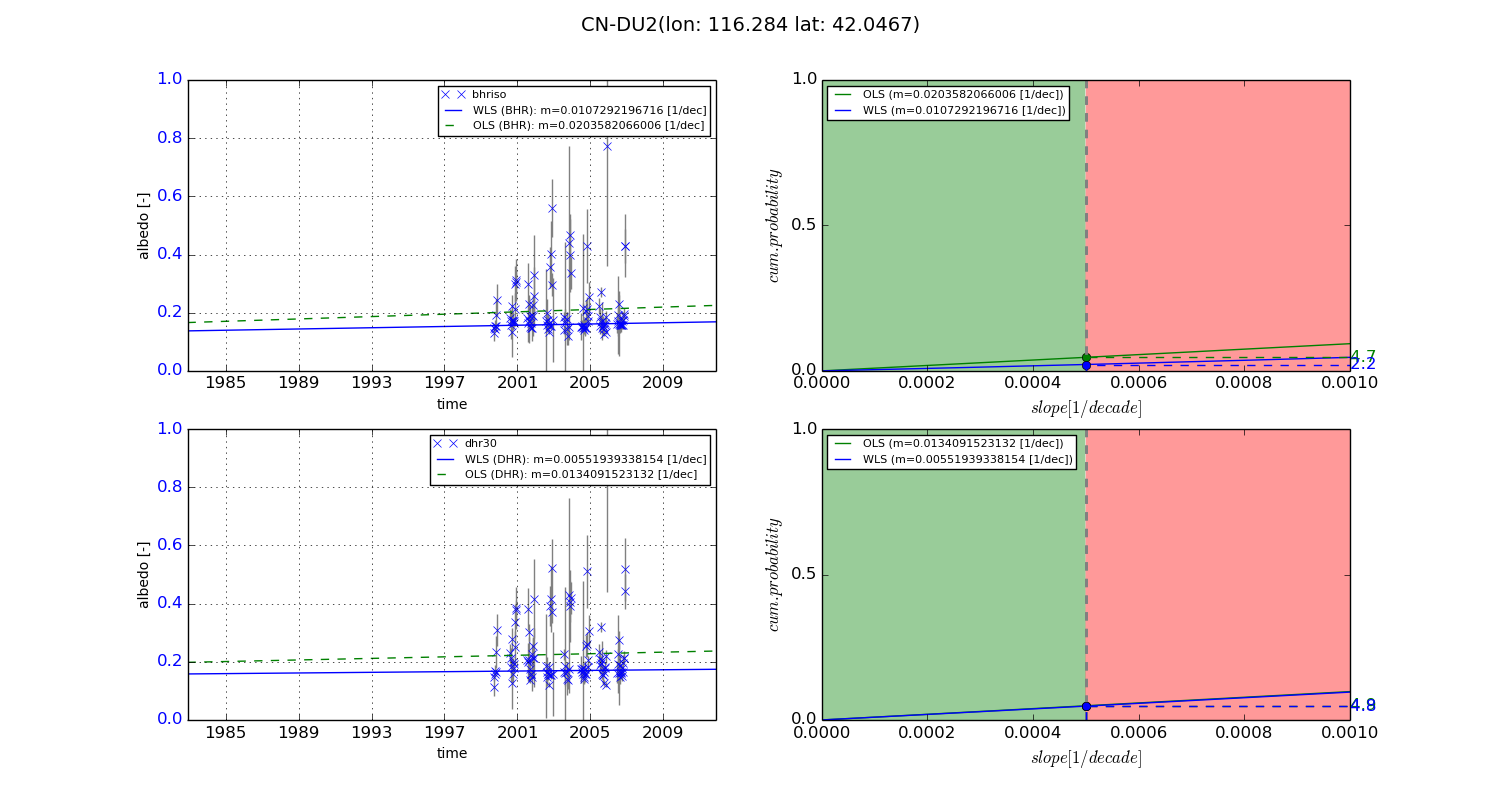
Temporal stability analysis

+000 deg (BHR)


BHR statistics

Temporal stability [1/decade]:


abs

rel


Weighted least square:

None


Ordinary least square:

None


Probabilities that GCOS criteria is met:

Weighted least square:

None %

Ordinary least square:

None %


DHR statistics

Temporal stability [1/decade]:


abs

rel


Weighted least square:

None


Ordinary least square:

None


Probabilities that GCOS criteria is met:

Weighted least square:

None %

Ordinary least square:

None %


+057/+063 deg (BHR)


BHR statistics

Temporal stability [1/decade]:


abs

rel


Weighted least square:

0.0107292196716


Ordinary least square:

0.0203582066006


Probabilities that GCOS criteria is met:

Weighted least square:

2.2 %

Ordinary least square:

4.7 %


DHR statistics

Temporal stability [1/decade]:


abs

rel


Weighted least square:

0.00551939338154


Ordinary least square:

0.0134091523132


Probabilities that GCOS criteria is met:

Weighted least square:

4.8 %

Ordinary least square:

4.9 %


Temporal anomaly analyis

The variance of the temporal anomalies provides an additional measure about the stability of the signal AFTER removal of the mean seasonal cylce.

+000 deg


+057/+063 deg