CN-HAM


Location

lon / lat [deg]: 101.18 / 37.37

Source network: FLUXNET


Geostationary surface albedo (GSA) data


“+000”


“+057/+063”


Landcover information (based on ESA CCI landcover data)


Landcover fractions @ 2km distance


Landcover fractions @ 20 km distance


Legend


Distance to open water bodies [km]:

28.36

Distance to urban areas [km]:

19.86


Radius: 1 km

Number of landcover classes:

3

Dominant landcover type:

10: cropland, rainfed

Fraction of dominant landcover type [%]:

54.0


Radius: 2 km

Number of landcover classes:

4

Dominant landcover type:

130: grassland

Fraction of dominant landcover type [%]:

41.0


Radius: 5 km

Number of landcover classes:

4

Dominant landcover type:

130: grassland

Fraction of dominant landcover type [%]:

60.0


Radius: 10 km

Number of landcover classes:

4

Dominant landcover type:

130: grassland

Fraction of dominant landcover type [%]:

71.0


Radius: 20 km

Number of landcover classes:

5

Dominant landcover type:

130: grassland

Fraction of dominant landcover type [%]:

78.0


Disturbances


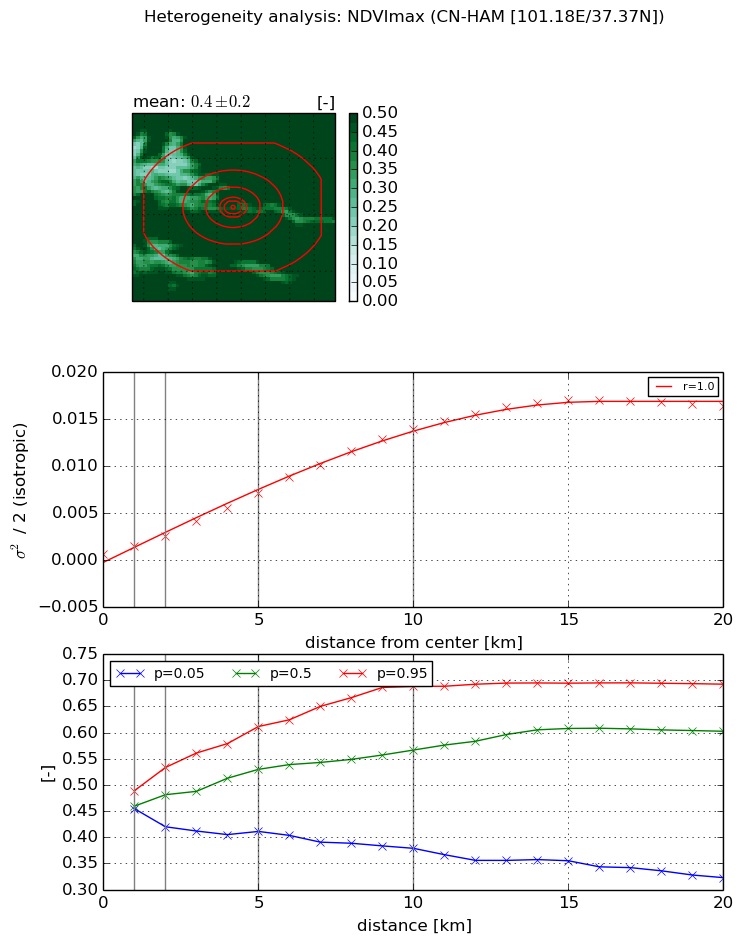
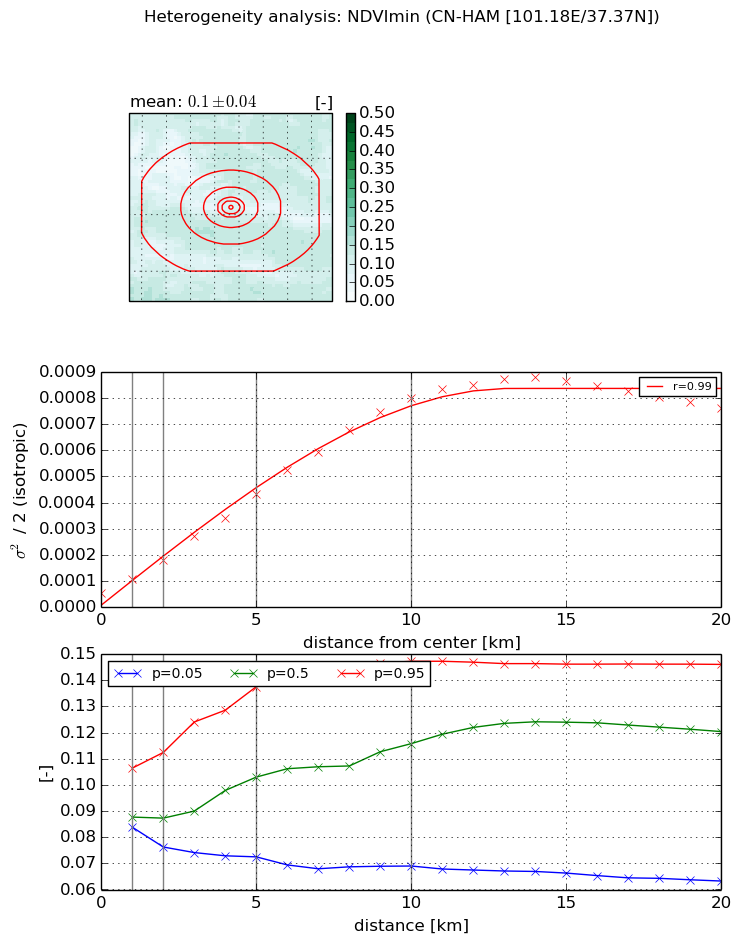
Heterogeneity analysis

The heterogeneity analysis provides information about the spatial and temporal heterogeneity of the site.

Topography


Roman et al. (2009) index


St

2.42396521186

Rcv

0.269247854178

Rse

0.0

Rst

-0.0639799112364

Rsv

0.904413759027


Height range @ 1km [m]

206

Height range @ 2km [m]

362

Height range @ 5km [m]

553

Height range @ 10km [m]

-999

Height range @ 20km [m]

-999


Variance slope @ 1 km

12523

Variance slope @ 2 km

10721

Variance slope @ 5 km

7280

Variance slope @ 10 km

-999

Variance slope @ 20 km

-999


NDVI (max. NDVI composite)


Roman et al. (2009) index


St

8.2473695667

Rcv

0.215548167257

Rse

0.0

Rst

-0.109744682487

Rsv

-0.038459492835


NDVI range @ 1km [-]

0.03

NDVI range @ 2km [-]

0.11

NDVI range @ 5km [-]

0.2

NDVI range @ 10km [-]

0.31

NDVI range @ 20km [-]

0.37


Variance slope @ 1 km

0.000779668550026

Variance slope @ 2 km

0.000956194521126

Variance slope @ 5 km

0.0013210592028

Variance slope @ 10 km

0.00139724254405

Variance slope @ 20 km

0.000874871365599


NDVI (min. NDVI composite)I


Roman et al. (2009) index


St

7.57803060059

Rcv

0.126649694378

Rse

0.0

Rst

-0.00796950008331

Rsv

0.261262025623


NDVI range @ 1km [-]

0.02

NDVI range @ 2km [-]

0.04

NDVI range @ 5km [-]

0.07

NDVI range @ 10km [-]

0.08

NDVI range @ 20km [-]

0.08


NDVI slope @ 1 km

5.31239488861e-05

NDVI slope @ 2 km

6.20721040332e-05

NDVI slope @ 5 km

7.68353695252e-05

NDVI slope @ 10 km

7.816008237e-05

NDVI slope @ 20 km

3.88947514064e-05


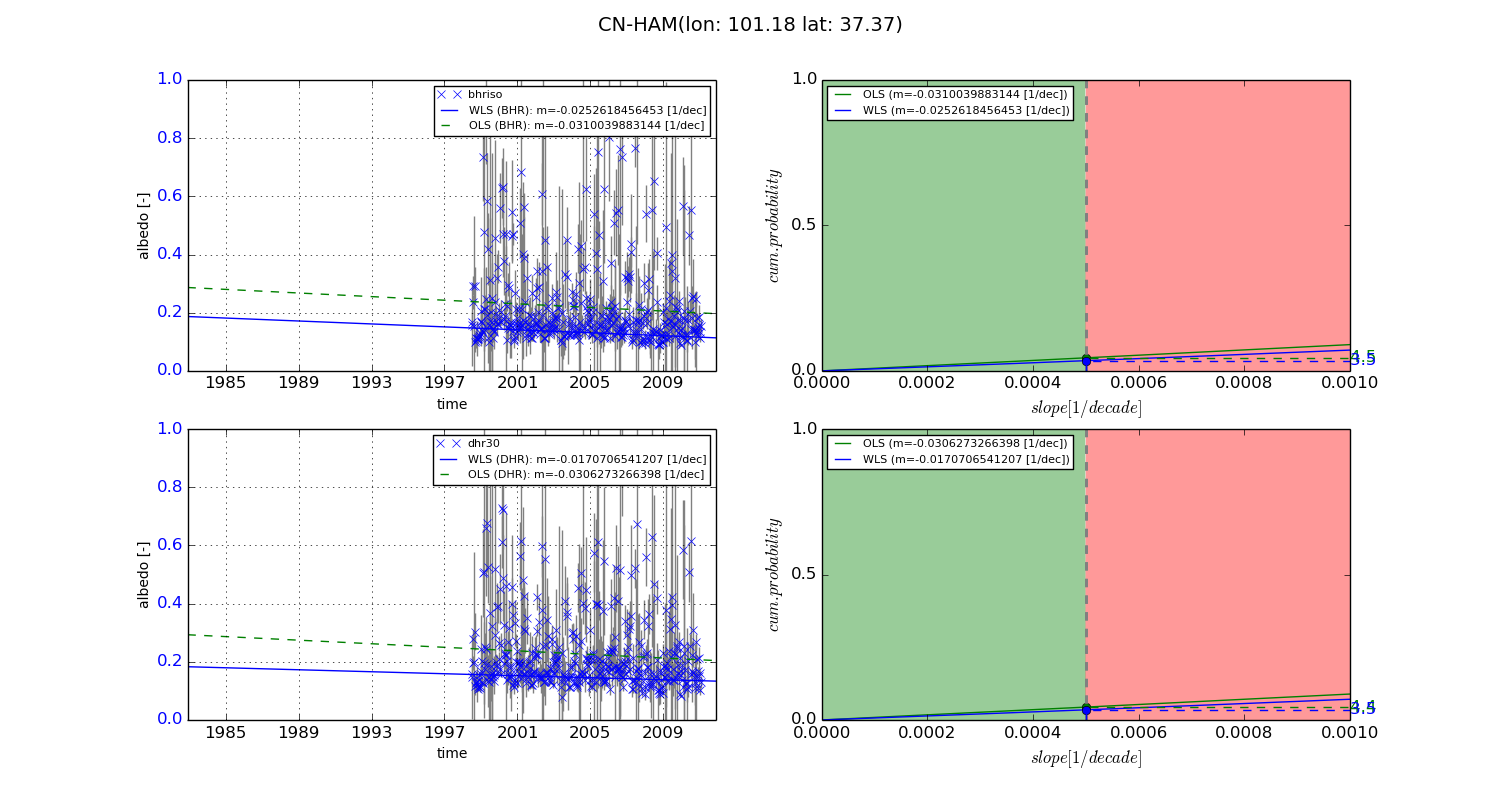
Temporal stability analysis

+000 deg (BHR)


BHR statistics

Temporal stability [1/decade]:


abs

rel


Weighted least square:

None


Ordinary least square:

None


Probabilities that GCOS criteria is met:

Weighted least square:

None %

Ordinary least square:

None %


DHR statistics

Temporal stability [1/decade]:


abs

rel


Weighted least square:

None


Ordinary least square:

None


Probabilities that GCOS criteria is met:

Weighted least square:

None %

Ordinary least square:

None %


+057/+063 deg (BHR)


BHR statistics

Temporal stability [1/decade]:


abs

rel


Weighted least square:

-0.0252618456453


Ordinary least square:

-0.0310039883144


Probabilities that GCOS criteria is met:

Weighted least square:

3.5 %

Ordinary least square:

4.5 %


DHR statistics

Temporal stability [1/decade]:


abs

rel


Weighted least square:

-0.0170706541207


Ordinary least square:

-0.0306273266398


Probabilities that GCOS criteria is met:

Weighted least square:

3.5 %

Ordinary least square:

4.4 %


Temporal anomaly analyis

The variance of the temporal anomalies provides an additional measure about the stability of the signal AFTER removal of the mean seasonal cylce.

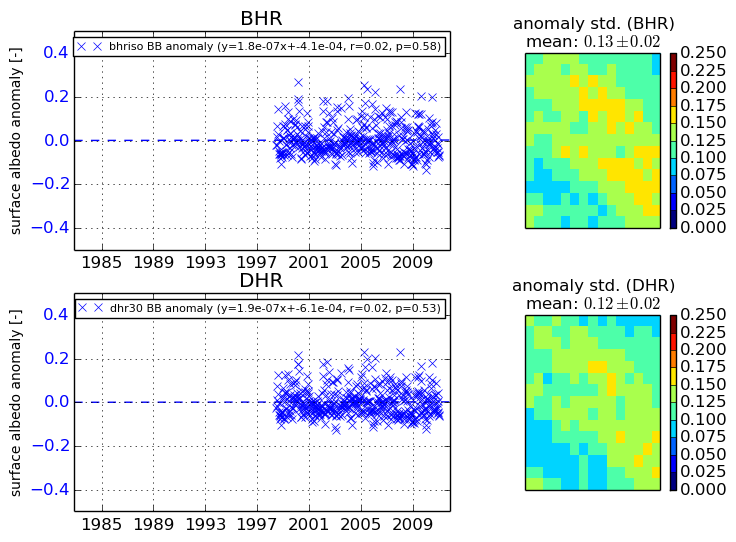
+000 deg


+057/+063 deg