CN-XFS


Location

lon / lat [deg]: 116.3286 / 44.1342

Source network: FLUXNET


Geostationary surface albedo (GSA) data


“+000”


“+057/+063”


Landcover information (based on ESA CCI landcover data)


Landcover fractions @ 2km distance


Landcover fractions @ 20 km distance


Legend


Distance to open water bodies [km]:

25.43

Distance to urban areas [km]:

22.63


Radius: 1 km

Number of landcover classes:

2

Dominant landcover type:

130: grassland

Fraction of dominant landcover type [%]:

96.0


Radius: 2 km

Number of landcover classes:

2

Dominant landcover type:

130: grassland

Fraction of dominant landcover type [%]:

96.0


Radius: 5 km

Number of landcover classes:

3

Dominant landcover type:

130: grassland

Fraction of dominant landcover type [%]:

87.0


Radius: 10 km

Number of landcover classes:

3

Dominant landcover type:

130: grassland

Fraction of dominant landcover type [%]:

90.0


Radius: 20 km

Number of landcover classes:

3

Dominant landcover type:

130: grassland

Fraction of dominant landcover type [%]:

82.0


Disturbances


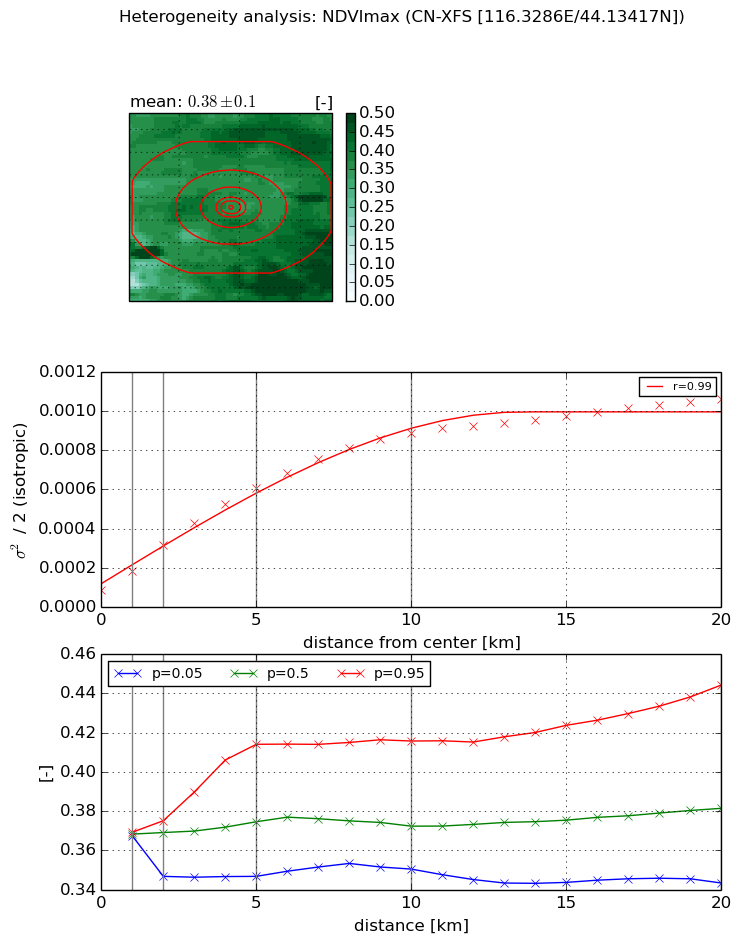
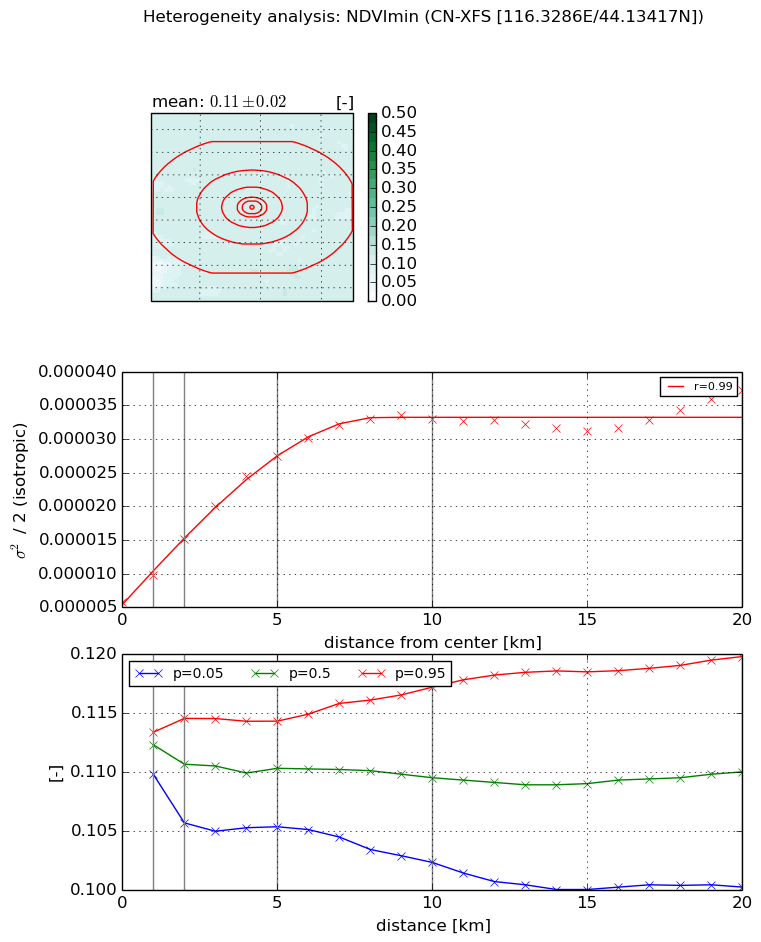
Heterogeneity analysis

The heterogeneity analysis provides information about the spatial and temporal heterogeneity of the site.

Topography


Roman et al. (2009) index


St

1.35054928564e-05

Rcv

0.442156459016

Rse

0.0

Rst

0.0224426703128

Rsv

222131.377007


Height range @ 1km [m]

31

Height range @ 2km [m]

66

Height range @ 5km [m]

132

Height range @ 10km [m]

-999

Height range @ 20km [m]

-999


Variance slope @ 1 km

333

Variance slope @ 2 km

368

Variance slope @ 5 km

321

Variance slope @ 10 km

-999

Variance slope @ 20 km

-999


NDVI (max. NDVI composite)


Roman et al. (2009) index


St

1.77361485295

Rcv

0.496483428567

Rse

0.0

Rst

-0.194977464248

Rsv

-0.999999908273


NDVI range @ 1km [-]

0.0

NDVI range @ 2km [-]

0.03

NDVI range @ 5km [-]

0.07

NDVI range @ 10km [-]

0.07

NDVI range @ 20km [-]

0.1


Variance slope @ 1 km

9.51513206706e-05

Variance slope @ 2 km

0.000114376024765

Variance slope @ 5 km

0.00010674346293

Variance slope @ 10 km

8.1468736016e-05

Variance slope @ 20 km

4.39890274741e-05


NDVI (min. NDVI composite)I


Roman et al. (2009) index


St

5.06217788027e-07

Rcv

-0.144487218915

Rse

0.0

Rst

-0.210118062878

Rsv

5926302.65362


NDVI range @ 1km [-]

0.0

NDVI range @ 2km [-]

0.01

NDVI range @ 5km [-]

0.01

NDVI range @ 10km [-]

0.01

NDVI range @ 20km [-]

0.02


NDVI slope @ 1 km

3.96555555858e-06

NDVI slope @ 2 km

4.66534303034e-06

NDVI slope @ 5 km

4.50912305487e-06

NDVI slope @ 10 km

2.85674362477e-06

NDVI slope @ 20 km

1.1186424529e-06


Temporal stability analysis

+000 deg (BHR)


BHR statistics

Temporal stability [1/decade]:


abs

rel


Weighted least square:

None


Ordinary least square:

None


Probabilities that GCOS criteria is met:

Weighted least square:

None %

Ordinary least square:

None %


DHR statistics

Temporal stability [1/decade]:


abs

rel


Weighted least square:

None


Ordinary least square:

None


Probabilities that GCOS criteria is met:

Weighted least square:

None %

Ordinary least square:

None %


+057/+063 deg (BHR)


BHR statistics

Temporal stability [1/decade]:


abs

rel


Weighted least square:

-99999.0


Ordinary least square:

-99999.0


Probabilities that GCOS criteria is met:

Weighted least square:

-99999.0 %

Ordinary least square:

-99999.0 %


DHR statistics

Temporal stability [1/decade]:


abs

rel


Weighted least square:

-99999.0


Ordinary least square:

-99999.0


Probabilities that GCOS criteria is met:

Weighted least square:

-99999.0 %

Ordinary least square:

-99999.0 %


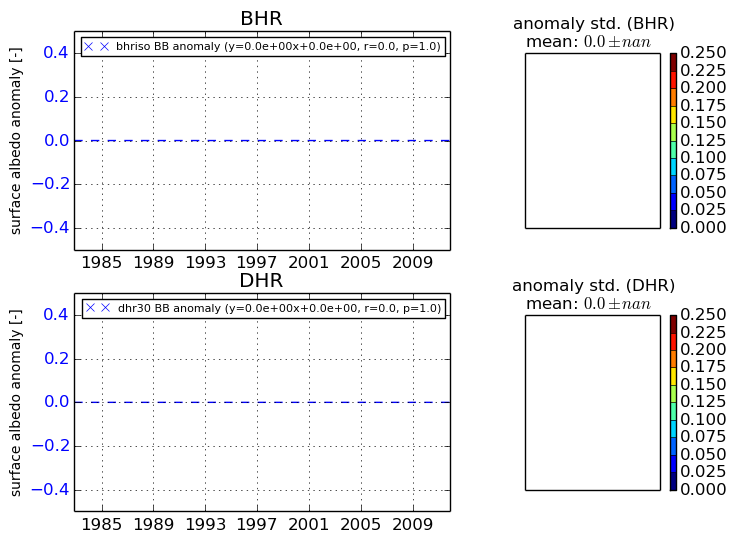
Temporal anomaly analyis

The variance of the temporal anomalies provides an additional measure about the stability of the signal AFTER removal of the mean seasonal cylce.

+000 deg


+057/+063 deg