CN-XI1


Location

lon / lat [deg]: 116.6778 / 43.5458

Source network: FLUXNET


Geostationary surface albedo (GSA) data


“+000”


“+057/+063”


Landcover information (based on ESA CCI landcover data)


Landcover fractions @ 2km distance


Landcover fractions @ 20 km distance


Legend


Distance to open water bodies [km]:

17.5

Distance to urban areas [km]:

7.22


Radius: 1 km

Number of landcover classes:

3

Dominant landcover type:

40: mosaic natural vegetation (tree, shrub, herbaceous cover) (>50%) / cropland (<50%)

Fraction of dominant landcover type [%]:

80.0


Radius: 2 km

Number of landcover classes:

3

Dominant landcover type:

40: mosaic natural vegetation (tree, shrub, herbaceous cover) (>50%) / cropland (<50%)

Fraction of dominant landcover type [%]:

71.0


Radius: 5 km

Number of landcover classes:

4

Dominant landcover type:

40: mosaic natural vegetation (tree, shrub, herbaceous cover) (>50%) / cropland (<50%)

Fraction of dominant landcover type [%]:

58.0


Radius: 10 km

Number of landcover classes:

4

Dominant landcover type:

40: mosaic natural vegetation (tree, shrub, herbaceous cover) (>50%) / cropland (<50%)

Fraction of dominant landcover type [%]:

41.0


Radius: 20 km

Number of landcover classes:

5

Dominant landcover type:

130: grassland

Fraction of dominant landcover type [%]:

42.0


Disturbances


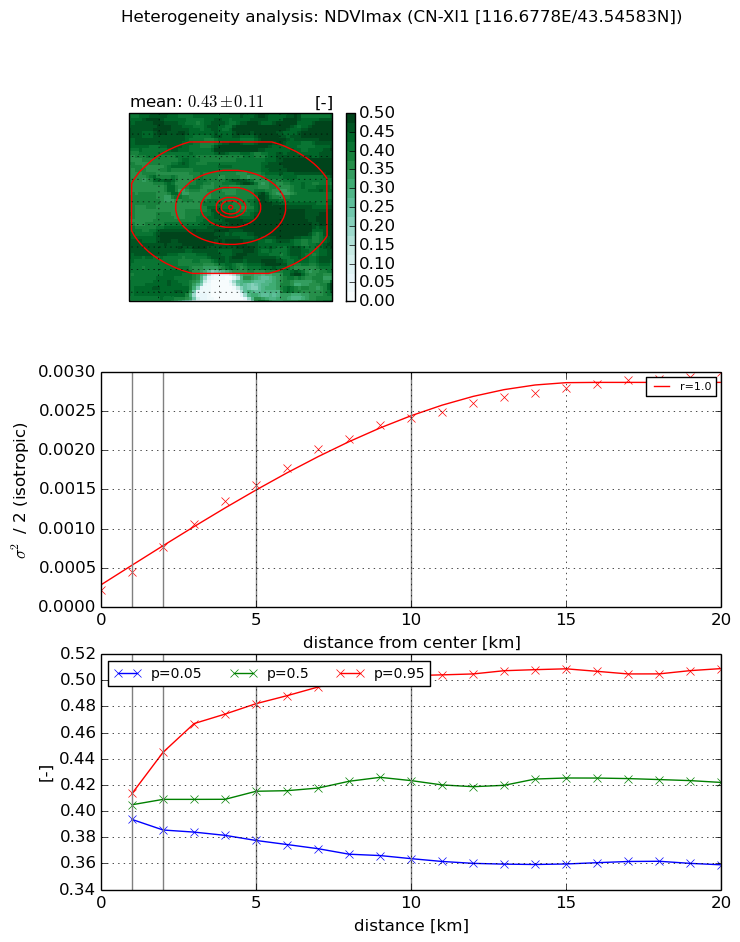
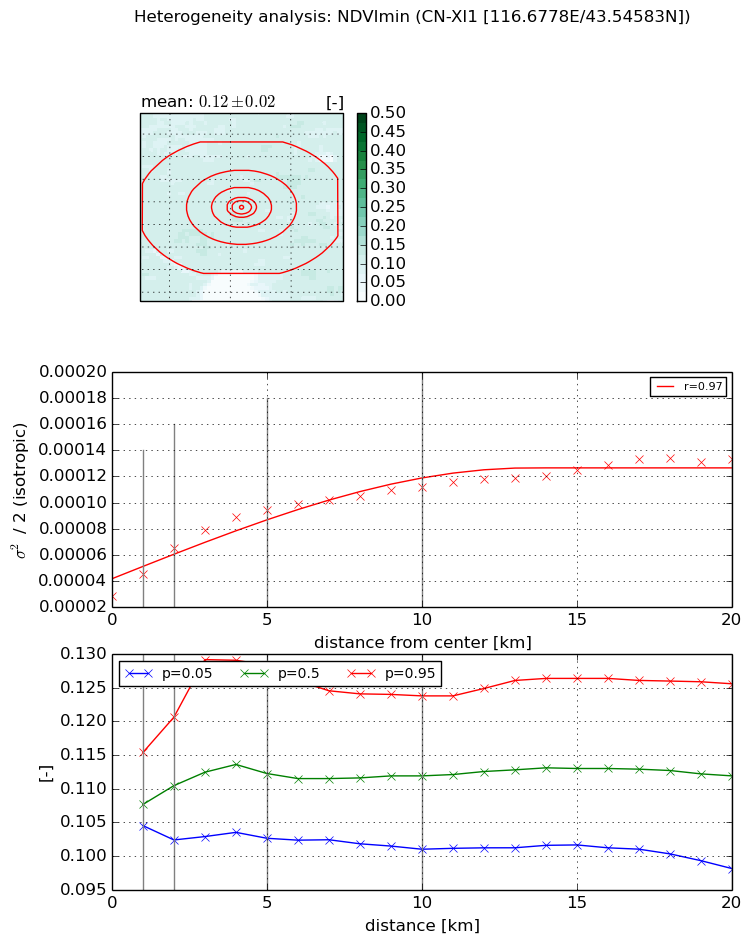
Heterogeneity analysis

The heterogeneity analysis provides information about the spatial and temporal heterogeneity of the site.

Topography


Roman et al. (2009) index


St

2.09795299101

Rcv

0.774984332195

Rse

0.0

Rst

-7.43289175894e-06

Rsv

-0.654973545314


Height range @ 1km [m]

34

Height range @ 2km [m]

48

Height range @ 5km [m]

136

Height range @ 10km [m]

-999

Height range @ 20km [m]

-999


Variance slope @ 1 km

381

Variance slope @ 2 km

308

Variance slope @ 5 km

353

Variance slope @ 10 km

-999

Variance slope @ 20 km

-999


NDVI (max. NDVI composite)


Roman et al. (2009) index


St

3.45813206009

Rcv

0.172971681592

Rse

0.0

Rst

-5.67970214482e-09

Rsv

0.694548681491


NDVI range @ 1km [-]

0.02

NDVI range @ 2km [-]

0.06

NDVI range @ 5km [-]

0.1

NDVI range @ 10km [-]

0.14

NDVI range @ 20km [-]

0.15


Variance slope @ 1 km

0.000223194756448

Variance slope @ 2 km

0.000271263271705

Variance slope @ 5 km

0.000275273334972

Variance slope @ 10 km

0.000226541685633

Variance slope @ 20 km

0.000132742307041


NDVI (min. NDVI composite)I


Roman et al. (2009) index


St

9.27038594688

Rcv

-0.0276234781177

Rse

0.0

Rst

-0.144341576481

Rsv

0.151646067656


NDVI range @ 1km [-]

0.01

NDVI range @ 2km [-]

0.02

NDVI range @ 5km [-]

0.03

NDVI range @ 10km [-]

0.02

NDVI range @ 20km [-]

0.03


NDVI slope @ 1 km

1.69993893356e-05

NDVI slope @ 2 km

1.84168267903e-05

NDVI slope @ 5 km

1.35400321949e-05

NDVI slope @ 10 km

7.72081703015e-06

NDVI slope @ 20 km

4.29791802012e-06


Temporal stability analysis

+000 deg (BHR)


BHR statistics

Temporal stability [1/decade]:


abs

rel


Weighted least square:

None


Ordinary least square:

None


Probabilities that GCOS criteria is met:

Weighted least square:

None %

Ordinary least square:

None %


DHR statistics

Temporal stability [1/decade]:


abs

rel


Weighted least square:

None


Ordinary least square:

None


Probabilities that GCOS criteria is met:

Weighted least square:

None %

Ordinary least square:

None %


+057/+063 deg (BHR)


BHR statistics

Temporal stability [1/decade]:


abs

rel


Weighted least square:

-99999.0


Ordinary least square:

-99999.0


Probabilities that GCOS criteria is met:

Weighted least square:

-99999.0 %

Ordinary least square:

-99999.0 %


DHR statistics

Temporal stability [1/decade]:


abs

rel


Weighted least square:

-99999.0


Ordinary least square:

-99999.0


Probabilities that GCOS criteria is met:

Weighted least square:

-99999.0 %

Ordinary least square:

-99999.0 %


Temporal anomaly analyis

The variance of the temporal anomalies provides an additional measure about the stability of the signal AFTER removal of the mean seasonal cylce.

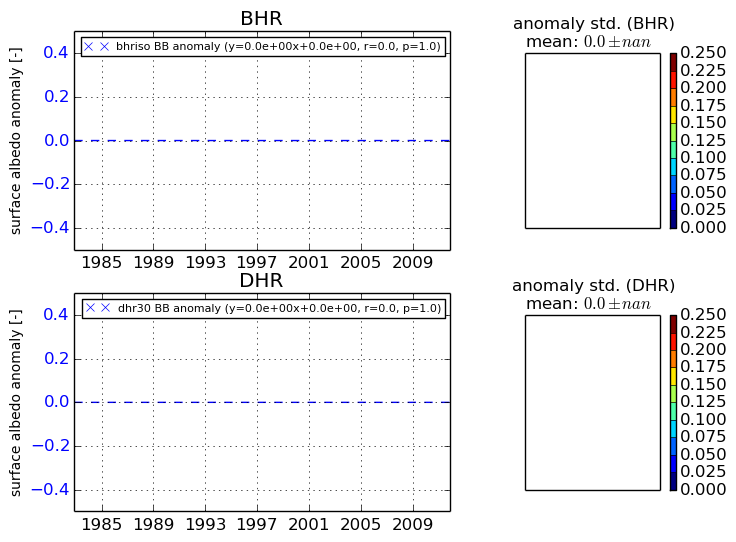
+000 deg


+057/+063 deg