CNR


Location

lon / lat [deg]: -1.601 / 42.816

Source network: BSRN


Geostationary surface albedo (GSA) data


“+000”


“+057/+063”


Landcover information (based on ESA CCI landcover data)


Landcover fractions @ 2km distance


Landcover fractions @ 20 km distance


Legend


Distance to open water bodies [km]:

4.2

Distance to urban areas [km]:

0.09


Radius: 1 km

Number of landcover classes:

2

Dominant landcover type:

190: urban areas

Fraction of dominant landcover type [%]:

78.0


Radius: 2 km

Number of landcover classes:

2

Dominant landcover type:

190: urban areas

Fraction of dominant landcover type [%]:

73.0


Radius: 5 km

Number of landcover classes:

6

Dominant landcover type:

10: cropland, rainfed

Fraction of dominant landcover type [%]:

44.0


Radius: 10 km

Number of landcover classes:

8

Dominant landcover type:

10: cropland, rainfed

Fraction of dominant landcover type [%]:

51.0


Radius: 20 km

Number of landcover classes:

9

Dominant landcover type:

10: cropland, rainfed

Fraction of dominant landcover type [%]:

47.0


Disturbances


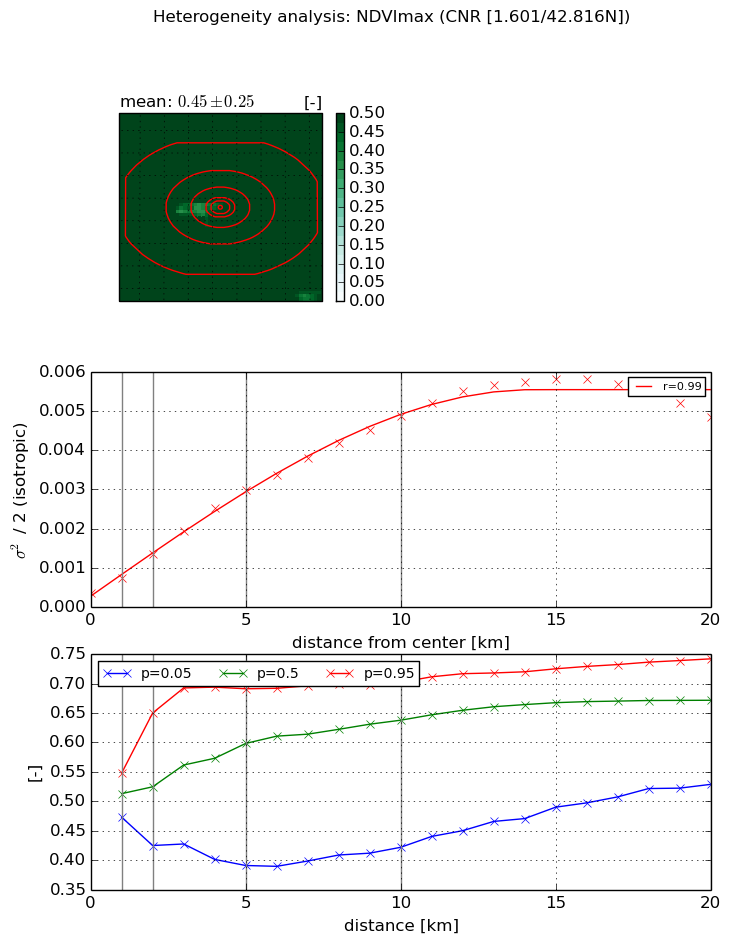
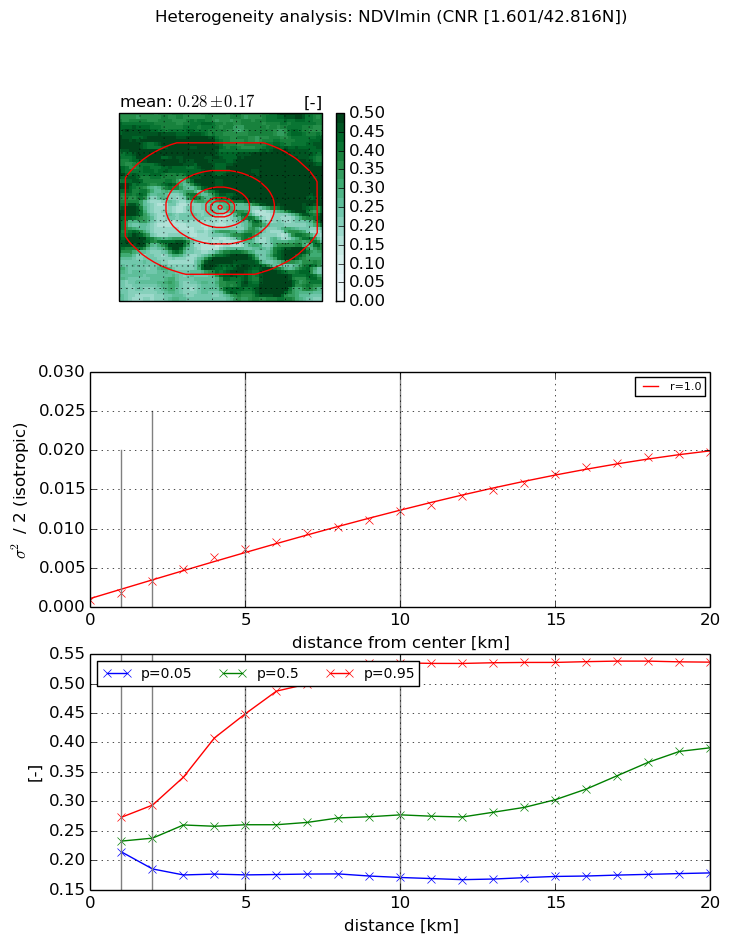
Heterogeneity analysis

The heterogeneity analysis provides information about the spatial and temporal heterogeneity of the site.

Topography


Roman et al. (2009) index


St

0.000319174279663

Rcv

1.14929996028

Rse

0.0

Rst

-0.0854848056447

Rsv

9398.01882415


Height range @ 1km [m]

35

Height range @ 2km [m]

70

Height range @ 5km [m]

220

Height range @ 10km [m]

-999

Height range @ 20km [m]

-999


Variance slope @ 1 km

1976

Variance slope @ 2 km

1729

Variance slope @ 5 km

993

Variance slope @ 10 km

-999

Variance slope @ 20 km

-999


NDVI (max. NDVI composite)


Roman et al. (2009) index


St

5.28312122014

Rcv

0.150058600838

Rse

0.0

Rst

-0.0723908321061

Rsv

0.345396708569


NDVI range @ 1km [-]

0.08

NDVI range @ 2km [-]

0.23

NDVI range @ 5km [-]

0.3

NDVI range @ 10km [-]

0.28

NDVI range @ 20km [-]

0.21


Variance slope @ 1 km

0.000399584667418

Variance slope @ 2 km

0.000499149010545

Variance slope @ 5 km

0.000545142579979

Variance slope @ 10 km

0.000461367809098

Variance slope @ 20 km

0.000255783989513


NDVI (min. NDVI composite)I


Roman et al. (2009) index


St

1.8958151657

Rcv

0.551243403283

Rse

0.0

Rst

-0.0311897279685

Rsv

-0.999999615508


NDVI range @ 1km [-]

0.06

NDVI range @ 2km [-]

0.11

NDVI range @ 5km [-]

0.27

NDVI range @ 10km [-]

0.36

NDVI range @ 20km [-]

0.36


NDVI slope @ 1 km

0.000971117261878

NDVI slope @ 2 km

0.00125124759614

NDVI slope @ 5 km

0.00137886944629

NDVI slope @ 10 km

0.00114407550584

NDVI slope @ 20 km

0.000962284993436


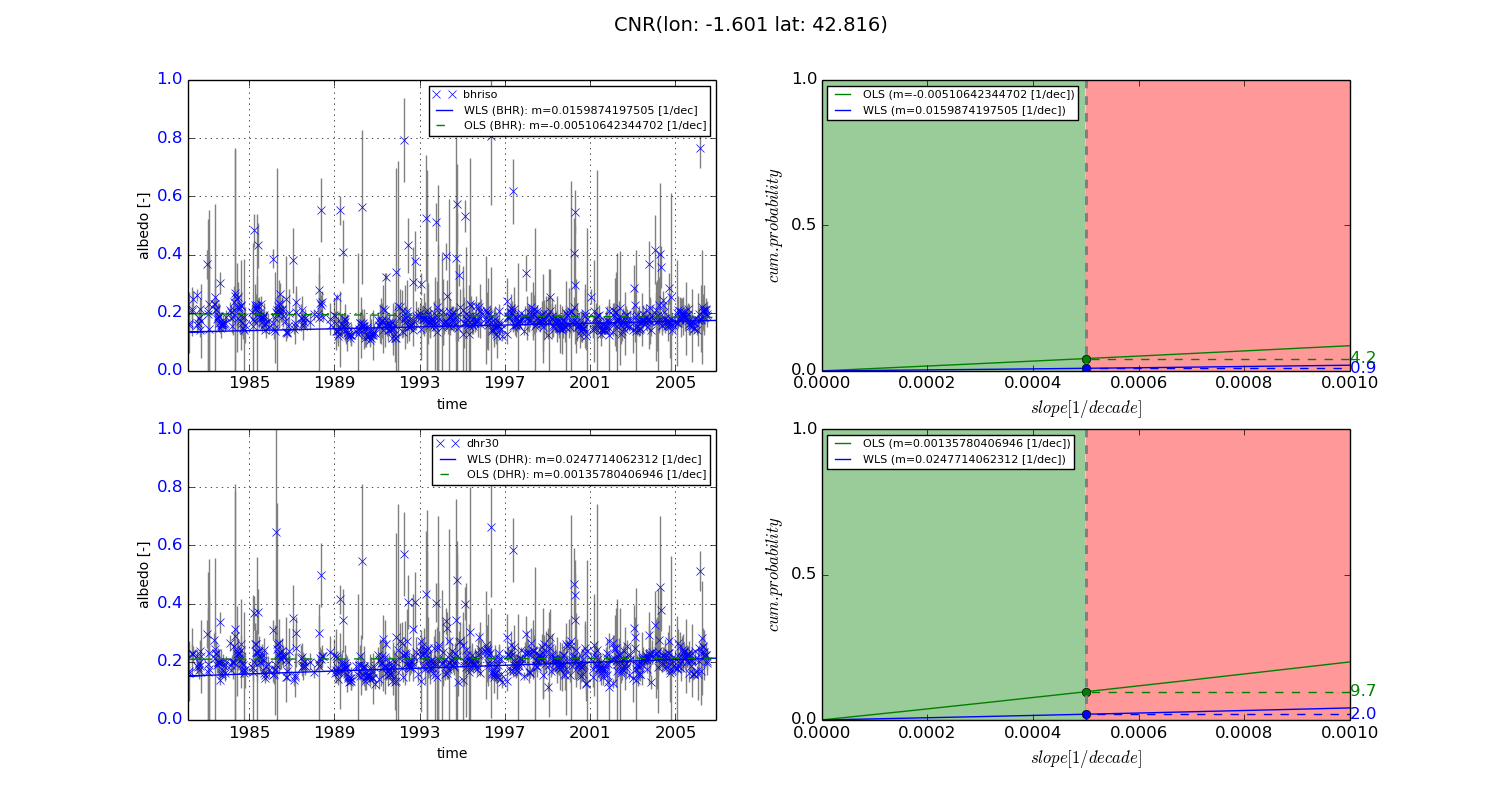
Temporal stability analysis

+000 deg (BHR)


BHR statistics

Temporal stability [1/decade]:


abs

rel


Weighted least square:

0.0159874197505


Ordinary least square:

-0.00510642344702


Probabilities that GCOS criteria is met:

Weighted least square:

0.9 %

Ordinary least square:

4.2 %


DHR statistics

Temporal stability [1/decade]:


abs

rel


Weighted least square:

0.0247714062312


Ordinary least square:

0.00135780406946


Probabilities that GCOS criteria is met:

Weighted least square:

2.0 %

Ordinary least square:

9.7 %


+057/+063 deg (BHR)


BHR statistics

Temporal stability [1/decade]:


abs

rel


Weighted least square:

-99999.0


Ordinary least square:

-99999.0


Probabilities that GCOS criteria is met:

Weighted least square:

-99999.0 %

Ordinary least square:

-99999.0 %


DHR statistics

Temporal stability [1/decade]:


abs

rel


Weighted least square:

-99999.0


Ordinary least square:

-99999.0


Probabilities that GCOS criteria is met:

Weighted least square:

-99999.0 %

Ordinary least square:

-99999.0 %


Temporal anomaly analyis

The variance of the temporal anomalies provides an additional measure about the stability of the signal AFTER removal of the mean seasonal cylce.
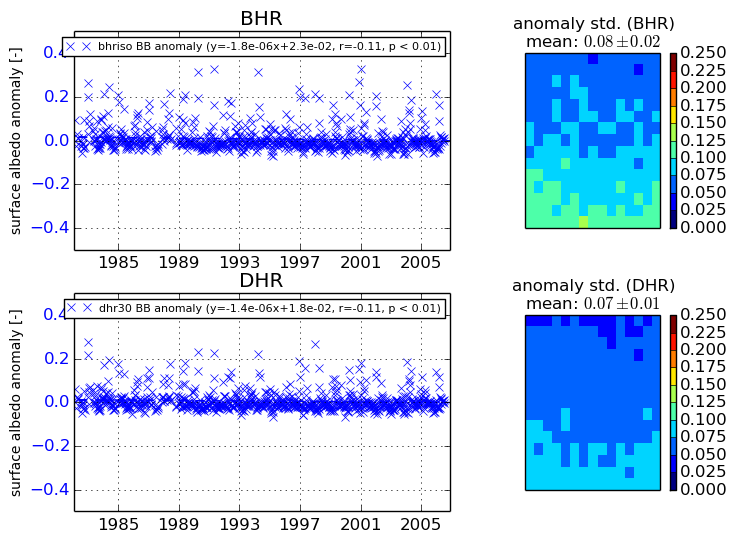
+000 deg


+057/+063 deg