COLUMBIA_SC


Location

lon / lat [deg]: -81.0363 / 34.0228

Source network: AERONET


Geostationary surface albedo (GSA) data


“+000”


“+057/+063”


Landcover information (based on ESA CCI landcover data)


Landcover fractions @ 2km distance


Landcover fractions @ 20 km distance


Legend


Distance to open water bodies [km]:

2.45

Distance to urban areas [km]:

0.14


Radius: 1 km

Number of landcover classes:

1

Dominant landcover type:

190: urban areas

Fraction of dominant landcover type [%]:

100.0


Radius: 2 km

Number of landcover classes:

1

Dominant landcover type:

190: urban areas

Fraction of dominant landcover type [%]:

100.0


Radius: 5 km

Number of landcover classes:

2

Dominant landcover type:

190: urban areas

Fraction of dominant landcover type [%]:

96.0


Radius: 10 km

Number of landcover classes:

5

Dominant landcover type:

190: urban areas

Fraction of dominant landcover type [%]:

77.0


Radius: 20 km

Number of landcover classes:

7

Dominant landcover type:

190: urban areas

Fraction of dominant landcover type [%]:

39.0


Disturbances


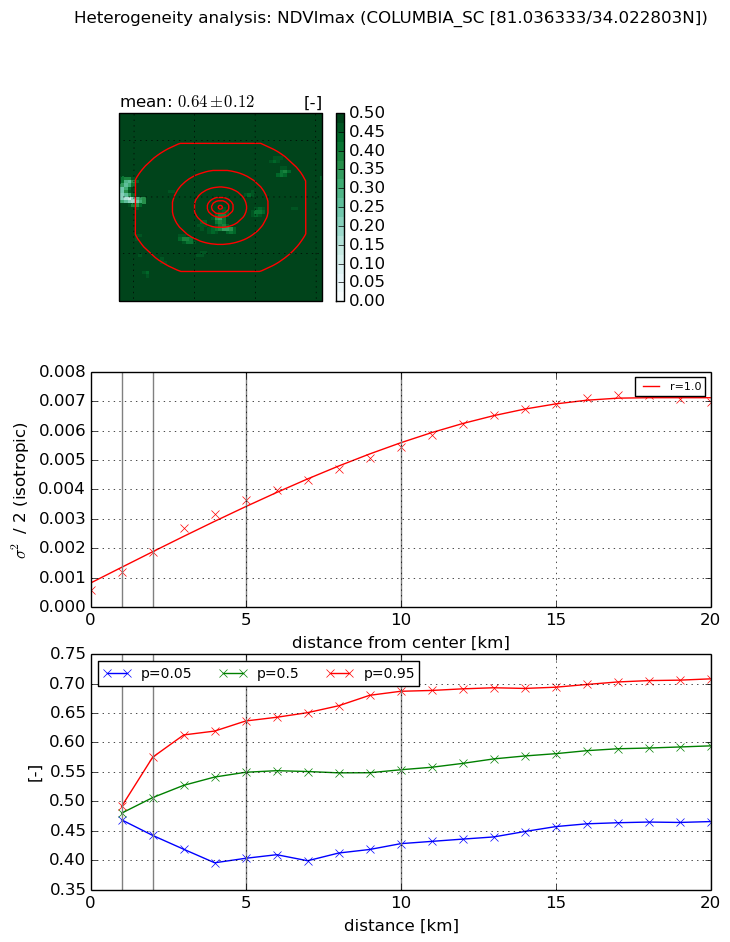
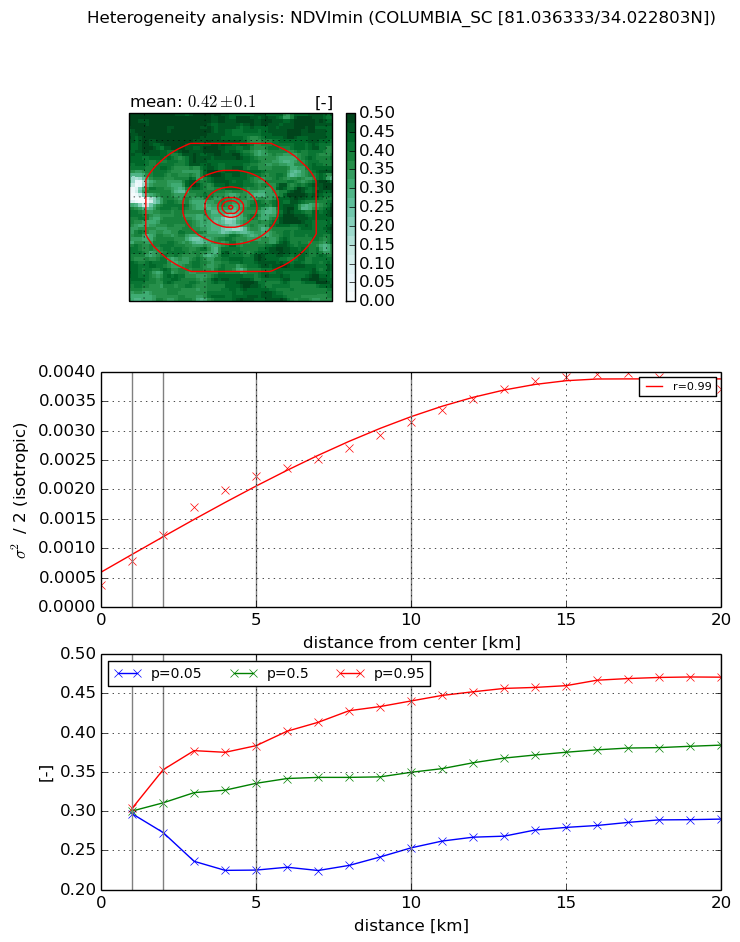
Heterogeneity analysis

The heterogeneity analysis provides information about the spatial and temporal heterogeneity of the site.

Topography


Roman et al. (2009) index


St

2.38687031326e-07

Rcv

0.201531384879

Rse

0.0

Rst

-0.174052279918

Rsv

12568759.5748


Height range @ 1km [m]

26

Height range @ 2km [m]

28

Height range @ 5km [m]

56

Height range @ 10km [m]

-999

Height range @ 20km [m]

-999


Variance slope @ 1 km

149

Variance slope @ 2 km

125

Variance slope @ 5 km

49

Variance slope @ 10 km

-999

Variance slope @ 20 km

-999


NDVI (max. NDVI composite)


Roman et al. (2009) index


St

34.3449915479

Rcv

0.0669432190901

Rse

0.0

Rst

-0.00457738000135

Rsv

0.0158283814962


NDVI range @ 1km [-]

0.02

NDVI range @ 2km [-]

0.13

NDVI range @ 5km [-]

0.23

NDVI range @ 10km [-]

0.26

NDVI range @ 20km [-]

0.24


Variance slope @ 1 km

0.000615082228758

Variance slope @ 2 km

0.000655775431934

Variance slope @ 5 km

0.000632646539355

Variance slope @ 10 km

0.000476577436759

Variance slope @ 20 km

0.000328406694678


NDVI (min. NDVI composite)I


Roman et al. (2009) index


St

6.86256664882

Rcv

0.107424444867

Rse

0.0

Rst

-0.050582650726

Rsv

0.279147128697


NDVI range @ 1km [-]

0.01

NDVI range @ 2km [-]

0.08

NDVI range @ 5km [-]

0.16

NDVI range @ 10km [-]

0.19

NDVI range @ 20km [-]

0.18


NDVI slope @ 1 km

0.000405516731171

NDVI slope @ 2 km

0.00042380547278

NDVI slope @ 5 km

0.000378950101279

NDVI slope @ 10 km

0.000261884631081

NDVI slope @ 20 km

0.00016857065378


Temporal stability analysis

+000 deg (BHR)


BHR statistics

Temporal stability [1/decade]:


abs

rel


Weighted least square:

None


Ordinary least square:

None


Probabilities that GCOS criteria is met:

Weighted least square:

None %

Ordinary least square:

None %


DHR statistics

Temporal stability [1/decade]:


abs

rel


Weighted least square:

None


Ordinary least square:

None


Probabilities that GCOS criteria is met:

Weighted least square:

None %

Ordinary least square:

None %


+057/+063 deg (BHR)


BHR statistics

Temporal stability [1/decade]:


abs

rel


Weighted least square:

None


Ordinary least square:

None


Probabilities that GCOS criteria is met:

Weighted least square:

None %

Ordinary least square:

None %


DHR statistics

Temporal stability [1/decade]:


abs

rel


Weighted least square:

None


Ordinary least square:

None


Probabilities that GCOS criteria is met:

Weighted least square:

None %

Ordinary least square:

None %


Temporal anomaly analyis

The variance of the temporal anomalies provides an additional measure about the stability of the signal AFTER removal of the mean seasonal cylce.

+000 deg


+057/+063 deg