CORCORAN


Location

lon / lat [deg]: -119.5661 / 36.1034

Source network: AERONET


Geostationary surface albedo (GSA) data


“+000”


“+057/+063”


Landcover information (based on ESA CCI landcover data)


Landcover fractions @ 2km distance


Landcover fractions @ 20 km distance


Legend


Distance to open water bodies [km]:

1.68

Distance to urban areas [km]:

0.11


Radius: 1 km

Number of landcover classes:

2

Dominant landcover type:

190: urban areas

Fraction of dominant landcover type [%]:

92.0


Radius: 2 km

Number of landcover classes:

5

Dominant landcover type:

190: urban areas

Fraction of dominant landcover type [%]:

63.0


Radius: 5 km

Number of landcover classes:

5

Dominant landcover type:

10: cropland, rainfed

Fraction of dominant landcover type [%]:

50.0


Radius: 10 km

Number of landcover classes:

6

Dominant landcover type:

10: cropland, rainfed

Fraction of dominant landcover type [%]:

70.0


Radius: 20 km

Number of landcover classes:

5

Dominant landcover type:

10: cropland, rainfed

Fraction of dominant landcover type [%]:

78.0


Disturbances


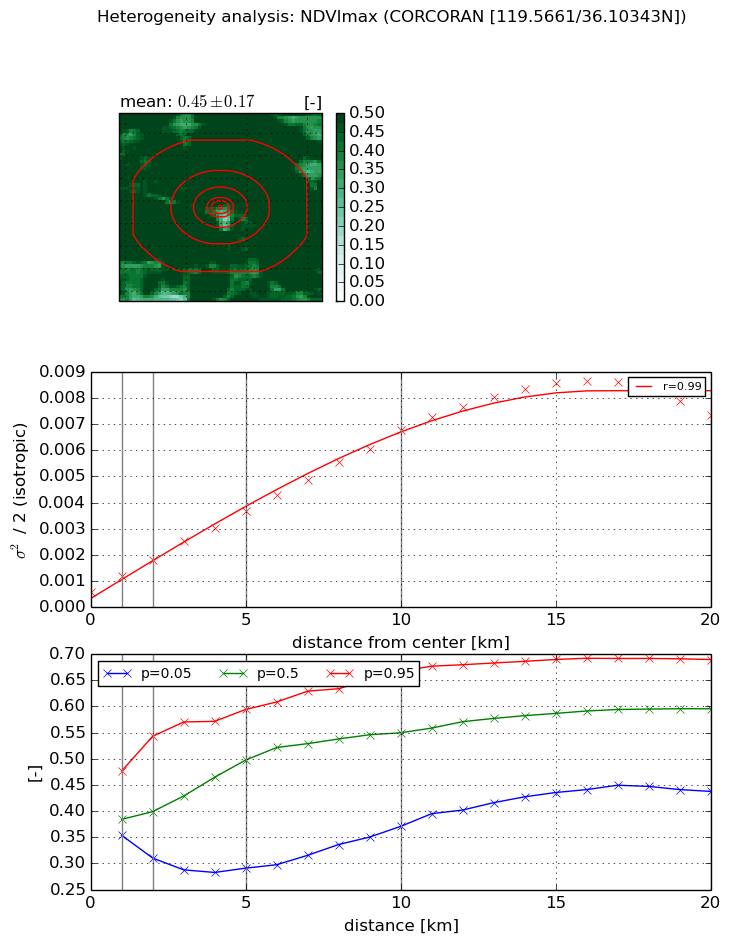
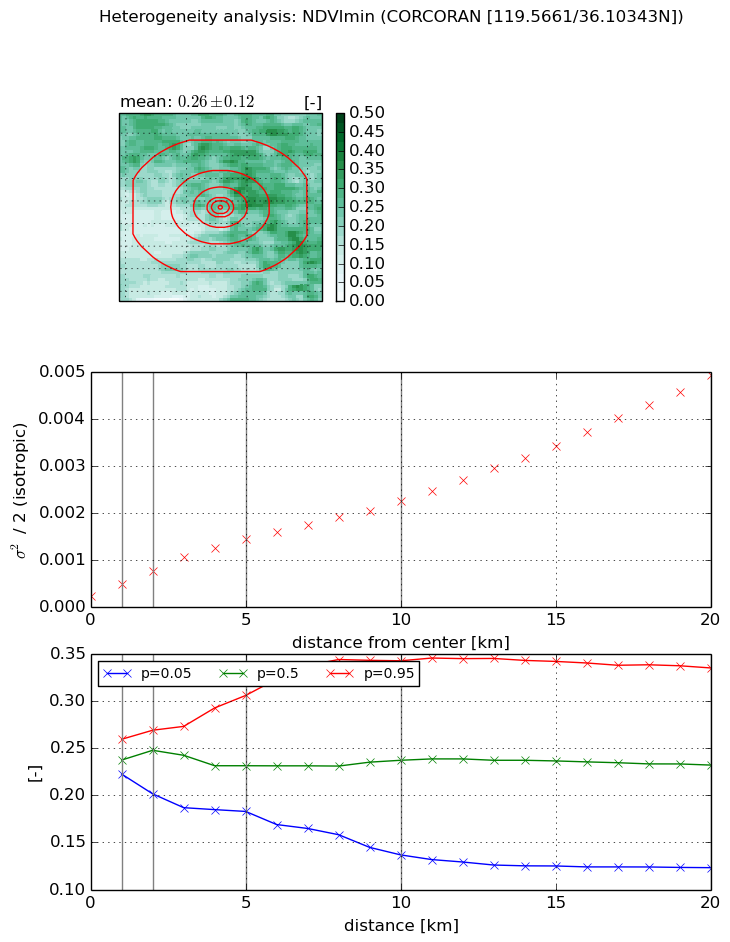
Heterogeneity analysis

The heterogeneity analysis provides information about the spatial and temporal heterogeneity of the site.

Topography


Roman et al. (2009) index


St

0.0988130901394

Rcv

0.288293763232

Rse

0.0

Rst

1.73114534089e-07

Rsv

30.0720560514


Height range @ 1km [m]

3

Height range @ 2km [m]

5

Height range @ 5km [m]

7

Height range @ 10km [m]

-999

Height range @ 20km [m]

-999


Variance slope @ 1 km

0

Variance slope @ 2 km

0

Variance slope @ 5 km

0

Variance slope @ 10 km

-999

Variance slope @ 20 km

-999


NDVI (max. NDVI composite)


Roman et al. (2009) index


St

11.7509434418

Rcv

-0.0790849724491

Rse

0.0

Rst

-0.0509597581304

Rsv

-0.125253919682


NDVI range @ 1km [-]

0.12

NDVI range @ 2km [-]

0.23

NDVI range @ 5km [-]

0.3

NDVI range @ 10km [-]

0.3

NDVI range @ 20km [-]

0.25


Variance slope @ 1 km

0.000611473582184

Variance slope @ 2 km

0.000619051197524

Variance slope @ 5 km

0.000620299609399

Variance slope @ 10 km

0.000614112771678

Variance slope @ 20 km

0.000405164229066


NDVI (min. NDVI composite)I


Roman et al. (2009) index


St

1.63972085776

Rcv

0.335492971936

Rse

0.0

Rst

-0.297179017955

Rsv

1.19690771314


NDVI range @ 1km [-]

0.04

NDVI range @ 2km [-]

0.07

NDVI range @ 5km [-]

0.12

NDVI range @ 10km [-]

0.21

NDVI range @ 20km [-]

0.21


NDVI slope @ 1 km

0.000261632524176

NDVI slope @ 2 km

0.000269023173687

NDVI slope @ 5 km

0.000245174342094

NDVI slope @ 10 km

0.000195133757207

NDVI slope @ 20 km

0.00021961734253


Temporal stability analysis

+000 deg (BHR)


BHR statistics

Temporal stability [1/decade]:


abs

rel


Weighted least square:

None


Ordinary least square:

None


Probabilities that GCOS criteria is met:

Weighted least square:

None %

Ordinary least square:

None %


DHR statistics

Temporal stability [1/decade]:


abs

rel


Weighted least square:

None


Ordinary least square:

None


Probabilities that GCOS criteria is met:

Weighted least square:

None %

Ordinary least square:

None %


+057/+063 deg (BHR)


BHR statistics

Temporal stability [1/decade]:


abs

rel


Weighted least square:

None


Ordinary least square:

None


Probabilities that GCOS criteria is met:

Weighted least square:

None %

Ordinary least square:

None %


DHR statistics

Temporal stability [1/decade]:


abs

rel


Weighted least square:

None


Ordinary least square:

None


Probabilities that GCOS criteria is met:

Weighted least square:

None %

Ordinary least square:

None %


Temporal anomaly analyis

The variance of the temporal anomalies provides an additional measure about the stability of the signal AFTER removal of the mean seasonal cylce.

+000 deg


+057/+063 deg