CRETEIL


Location

lon / lat [deg]: 2.4428 / 48.7885

Source network: AERONET


Geostationary surface albedo (GSA) data


“+000”


“+057/+063”


Landcover information (based on ESA CCI landcover data)


Landcover fractions @ 2km distance


Landcover fractions @ 20 km distance


Legend


Distance to open water bodies [km]:

1.22

Distance to urban areas [km]:

0.11


Radius: 1 km

Number of landcover classes:

1

Dominant landcover type:

190: urban areas

Fraction of dominant landcover type [%]:

100.0


Radius: 2 km

Number of landcover classes:

2

Dominant landcover type:

190: urban areas

Fraction of dominant landcover type [%]:

96.0


Radius: 5 km

Number of landcover classes:

2

Dominant landcover type:

190: urban areas

Fraction of dominant landcover type [%]:

99.0


Radius: 10 km

Number of landcover classes:

3

Dominant landcover type:

190: urban areas

Fraction of dominant landcover type [%]:

95.0


Radius: 20 km

Number of landcover classes:

3

Dominant landcover type:

190: urban areas

Fraction of dominant landcover type [%]:

83.0


Disturbances


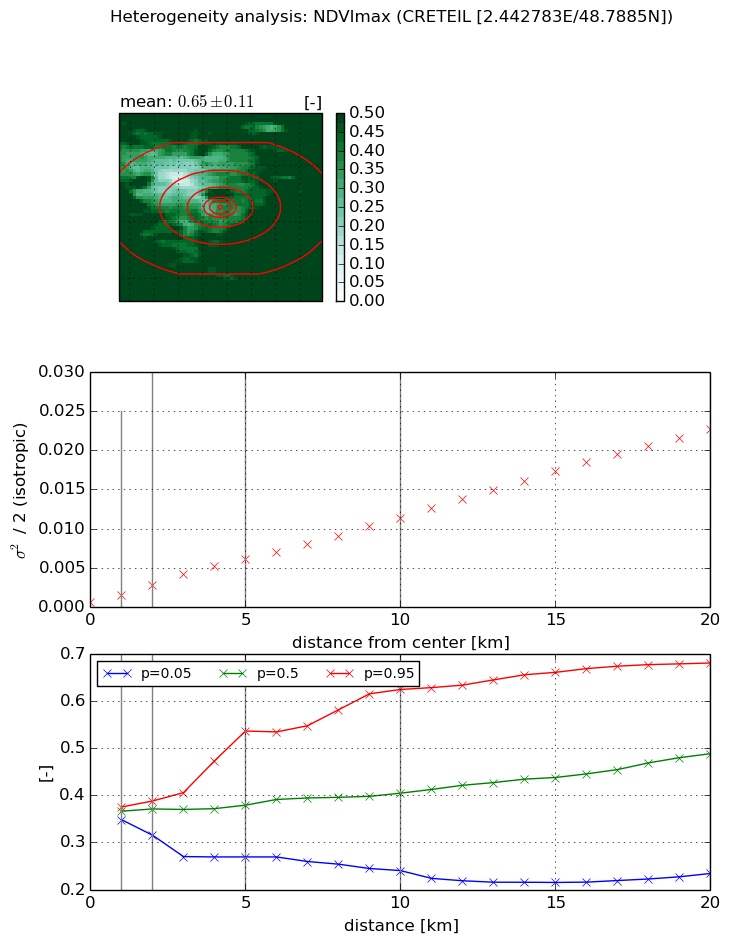
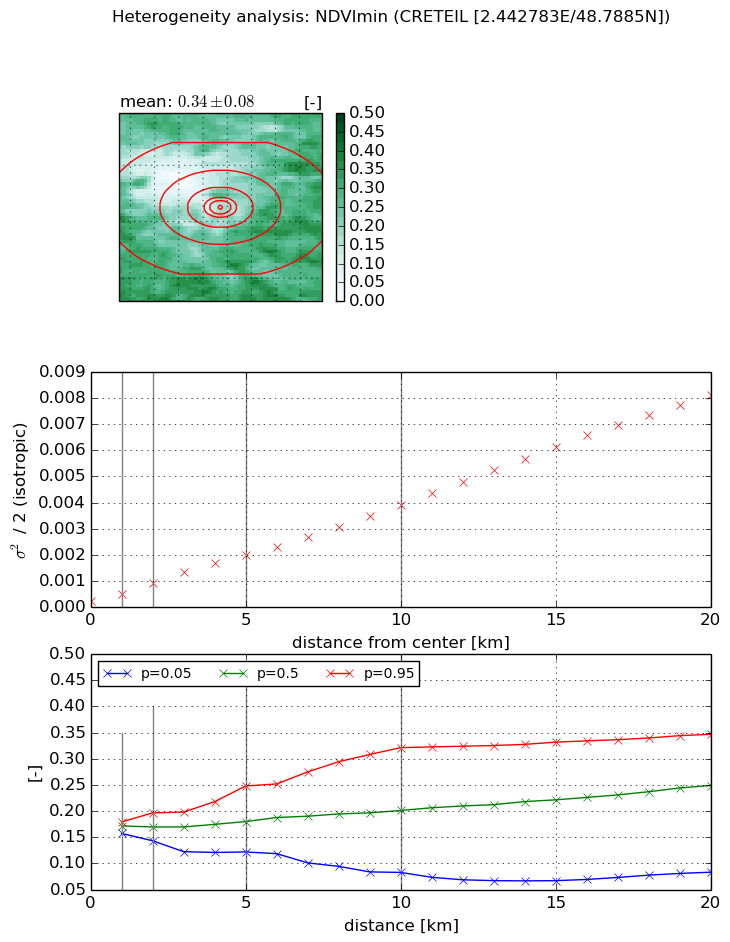
Heterogeneity analysis

The heterogeneity analysis provides information about the spatial and temporal heterogeneity of the site.

Topography


Roman et al. (2009) index


St

2.89043979256

Rcv

0.670701843035

Rse

0.0

Rst

0.167209934569

Rsv

-0.199992560595


Height range @ 1km [m]

9

Height range @ 2km [m]

17

Height range @ 5km [m]

36

Height range @ 10km [m]

-999

Height range @ 20km [m]

-999


Variance slope @ 1 km

88

Variance slope @ 2 km

89

Variance slope @ 5 km

62

Variance slope @ 10 km

-999

Variance slope @ 20 km

-999


NDVI (max. NDVI composite)


Roman et al. (2009) index


St

4.43418887861

Rcv

0.548115643272

Rse

0.0

Rst

-0.127932796447

Rsv

0.00051272673682


NDVI range @ 1km [-]

0.03

NDVI range @ 2km [-]

0.07

NDVI range @ 5km [-]

0.27

NDVI range @ 10km [-]

0.38

NDVI range @ 20km [-]

0.45


Variance slope @ 1 km

0.000895993557166

Variance slope @ 2 km

0.00107813264147

Variance slope @ 5 km

0.00114106802975

Variance slope @ 10 km

0.00106072814641

Variance slope @ 20 km

0.00110645685284


NDVI (min. NDVI composite)I


Roman et al. (2009) index


St

4.39638779242

Rcv

0.44564979727

Rse

0.0

Rst

0.075775752309

Rsv

-0.160952835051


NDVI range @ 1km [-]

0.02

NDVI range @ 2km [-]

0.05

NDVI range @ 5km [-]

0.13

NDVI range @ 10km [-]

0.24

NDVI range @ 20km [-]

0.26


NDVI slope @ 1 km

0.000287548889158

NDVI slope @ 2 km

0.000344178440467

NDVI slope @ 5 km

0.000365741334032

NDVI slope @ 10 km

0.00036433820651

NDVI slope @ 20 km

0.000402598578792


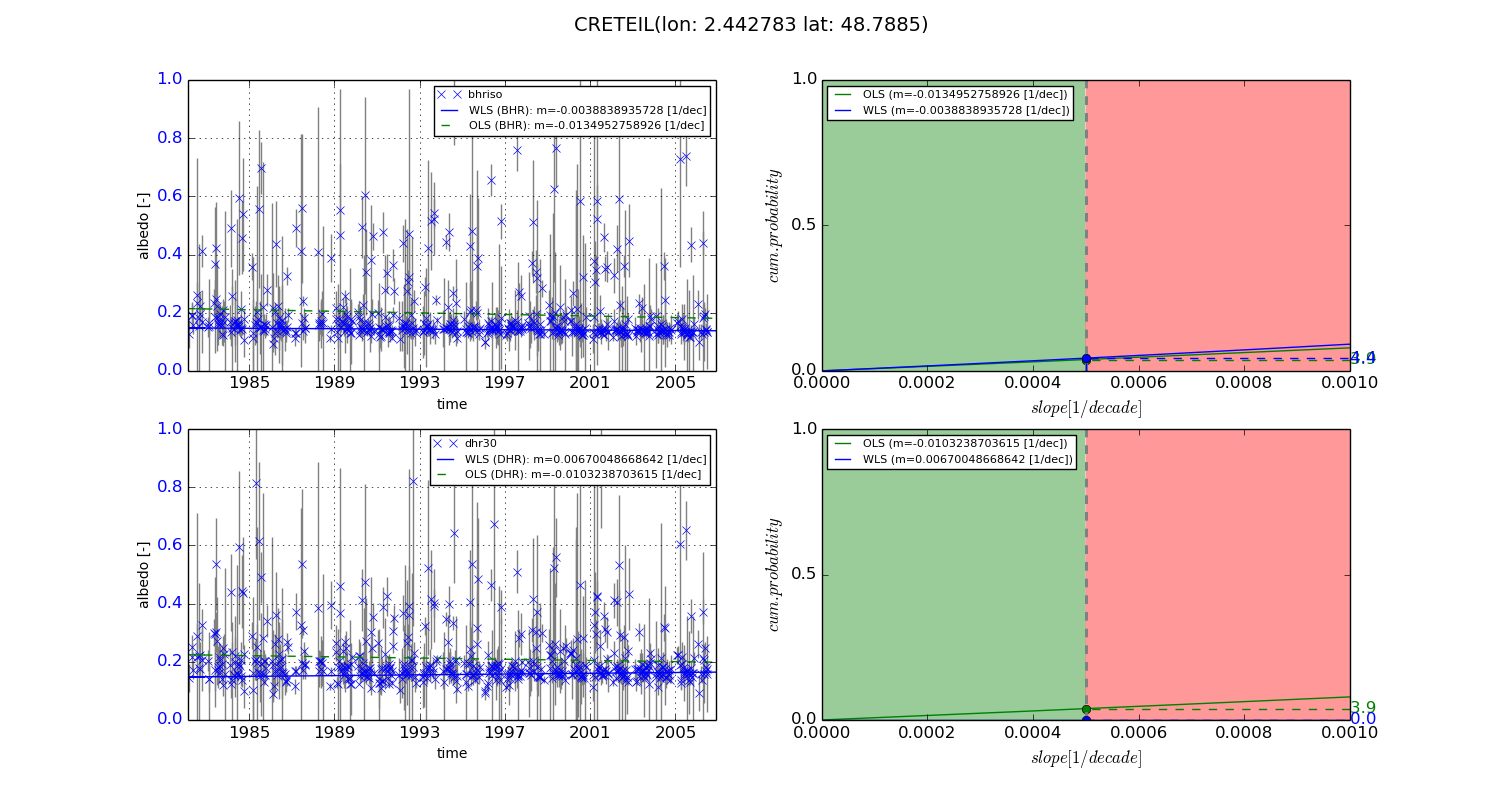
Temporal stability analysis

+000 deg (BHR)


BHR statistics

Temporal stability [1/decade]:


abs

rel


Weighted least square:

-0.0038838935728


Ordinary least square:

-0.0134952758926


Probabilities that GCOS criteria is met:

Weighted least square:

4.4 %

Ordinary least square:

3.9 %


DHR statistics

Temporal stability [1/decade]:


abs

rel


Weighted least square:

0.00670048668642


Ordinary least square:

-0.0103238703615


Probabilities that GCOS criteria is met:

Weighted least square:

0.0 %

Ordinary least square:

3.9 %


+057/+063 deg (BHR)


BHR statistics

Temporal stability [1/decade]:


abs

rel


Weighted least square:

-99999.0


Ordinary least square:

-99999.0


Probabilities that GCOS criteria is met:

Weighted least square:

-99999.0 %

Ordinary least square:

-99999.0 %


DHR statistics

Temporal stability [1/decade]:


abs

rel


Weighted least square:

-99999.0


Ordinary least square:

-99999.0


Probabilities that GCOS criteria is met:

Weighted least square:

-99999.0 %

Ordinary least square:

-99999.0 %


Temporal anomaly analyis

The variance of the temporal anomalies provides an additional measure about the stability of the signal AFTER removal of the mean seasonal cylce.
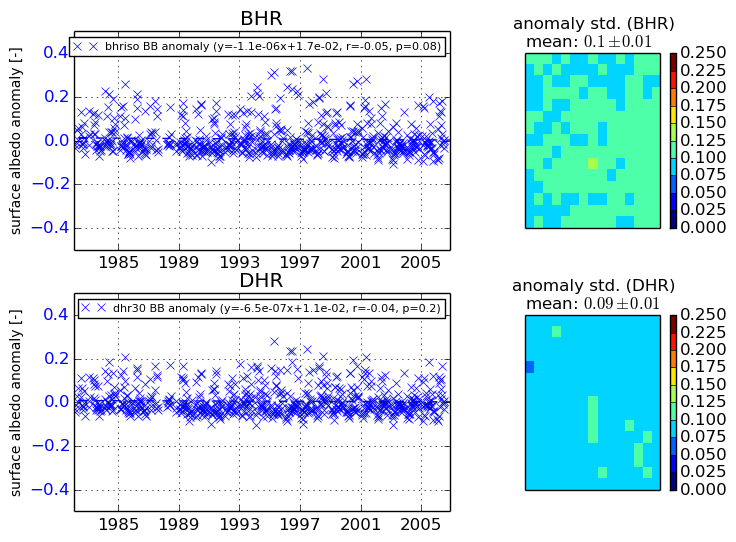
+000 deg


+057/+063 deg