CUIABA-MIRANDA


Location

lon / lat [deg]: -56.0208 / -15.7295

Source network: AERONET


Geostationary surface albedo (GSA) data


“+000”


“+057/+063”


Landcover information (based on ESA CCI landcover data)


Landcover fractions @ 2km distance


Landcover fractions @ 20 km distance


Legend


Distance to open water bodies [km]:

5.4

Distance to urban areas [km]:

4.72


Radius: 1 km

Number of landcover classes:

2

Dominant landcover type:

120: Shrubland

Fraction of dominant landcover type [%]:

83.0


Radius: 2 km

Number of landcover classes:

4

Dominant landcover type:

120: Shrubland

Fraction of dominant landcover type [%]:

70.0


Radius: 5 km

Number of landcover classes:

4

Dominant landcover type:

120: Shrubland

Fraction of dominant landcover type [%]:

66.0


Radius: 10 km

Number of landcover classes:

8

Dominant landcover type:

120: Shrubland

Fraction of dominant landcover type [%]:

42.0


Radius: 20 km

Number of landcover classes:

9

Dominant landcover type:

120: Shrubland

Fraction of dominant landcover type [%]:

37.0


Disturbances


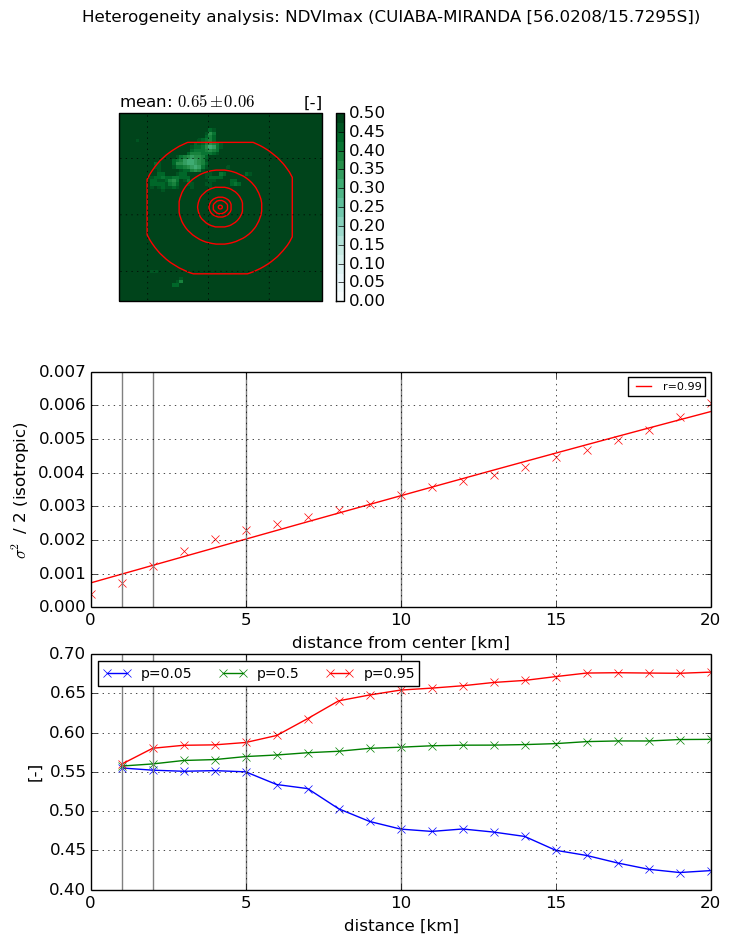
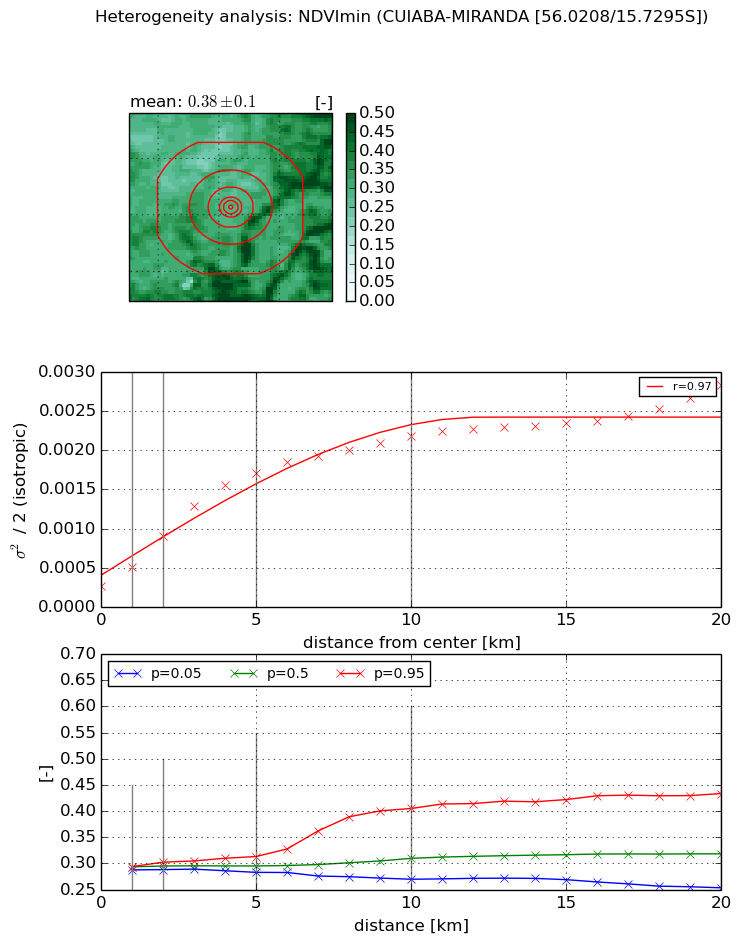
Heterogeneity analysis

The heterogeneity analysis provides information about the spatial and temporal heterogeneity of the site.

Topography


Roman et al. (2009) index


St

0.0774025244154

Rcv

0.356760003323

Rse

0.0

Rst

3.31157040512e-06

Rsv

38.4016624943


Height range @ 1km [m]

9

Height range @ 2km [m]

18

Height range @ 5km [m]

38

Height range @ 10km [m]

-999

Height range @ 20km [m]

-999


Variance slope @ 1 km

28

Variance slope @ 2 km

27

Variance slope @ 5 km

27

Variance slope @ 10 km

-999

Variance slope @ 20 km

-999


NDVI (max. NDVI composite)


Roman et al. (2009) index


St

0.816343310623

Rcv

0.189730094105

Rse

0.0

Rst

-0.550643557903

Rsv

2.93455080803


NDVI range @ 1km [-]

0.0

NDVI range @ 2km [-]

0.03

NDVI range @ 5km [-]

0.04

NDVI range @ 10km [-]

0.18

NDVI range @ 20km [-]

0.25


Variance slope @ 1 km

0.000328397971523

Variance slope @ 2 km

0.000419511448986

Variance slope @ 5 km

0.000397463576962

Variance slope @ 10 km

0.000288238831366

Variance slope @ 20 km

0.000255331415526


NDVI (min. NDVI composite)I


Roman et al. (2009) index


St

0.569724128609

Rcv

1.37858877075

Rse

0.0

Rst

-0.440976132908

Rsv

3.44614151345


NDVI range @ 1km [-]

0.01

NDVI range @ 2km [-]

0.01

NDVI range @ 5km [-]

0.03

NDVI range @ 10km [-]

0.14

NDVI range @ 20km [-]

0.18


NDVI slope @ 1 km

0.000244745353252

NDVI slope @ 2 km

0.000319497970633

NDVI slope @ 5 km

0.000304786931375

NDVI slope @ 10 km

0.000188251680334

NDVI slope @ 20 km

0.000100678728779


Temporal stability analysis

+000 deg (BHR)


BHR statistics

Temporal stability [1/decade]:


abs

rel


Weighted least square:

-99999.0


Ordinary least square:

-99999.0


Probabilities that GCOS criteria is met:

Weighted least square:

-99999.0 %

Ordinary least square:

-99999.0 %


DHR statistics

Temporal stability [1/decade]:


abs

rel


Weighted least square:

-99999.0


Ordinary least square:

-99999.0


Probabilities that GCOS criteria is met:

Weighted least square:

-99999.0 %

Ordinary least square:

-99999.0 %


+057/+063 deg (BHR)


BHR statistics

Temporal stability [1/decade]:


abs

rel


Weighted least square:

None


Ordinary least square:

None


Probabilities that GCOS criteria is met:

Weighted least square:

None %

Ordinary least square:

None %


DHR statistics

Temporal stability [1/decade]:


abs

rel


Weighted least square:

None


Ordinary least square:

None


Probabilities that GCOS criteria is met:

Weighted least square:

None %

Ordinary least square:

None %


Temporal anomaly analyis

The variance of the temporal anomalies provides an additional measure about the stability of the signal AFTER removal of the mean seasonal cylce.

+000 deg


+057/+063 deg