CUIABA_00001


Location

lon / lat [deg]: -56.0 / -15.5

Source network: AERONET


Geostationary surface albedo (GSA) data


“+000”


“+057/+063”


Landcover information (based on ESA CCI landcover data)


Landcover fractions @ 2km distance


Landcover fractions @ 20 km distance


Legend


Distance to open water bodies [km]:

12.33

Distance to urban areas [km]:

4.38


Radius: 1 km

Number of landcover classes:

1

Dominant landcover type:

120: Shrubland

Fraction of dominant landcover type [%]:

100.0


Radius: 2 km

Number of landcover classes:

3

Dominant landcover type:

120: Shrubland

Fraction of dominant landcover type [%]:

89.0


Radius: 5 km

Number of landcover classes:

6

Dominant landcover type:

120: Shrubland

Fraction of dominant landcover type [%]:

64.0


Radius: 10 km

Number of landcover classes:

7

Dominant landcover type:

120: Shrubland

Fraction of dominant landcover type [%]:

65.0


Radius: 20 km

Number of landcover classes:

7

Dominant landcover type:

120: Shrubland

Fraction of dominant landcover type [%]:

54.0


Disturbances


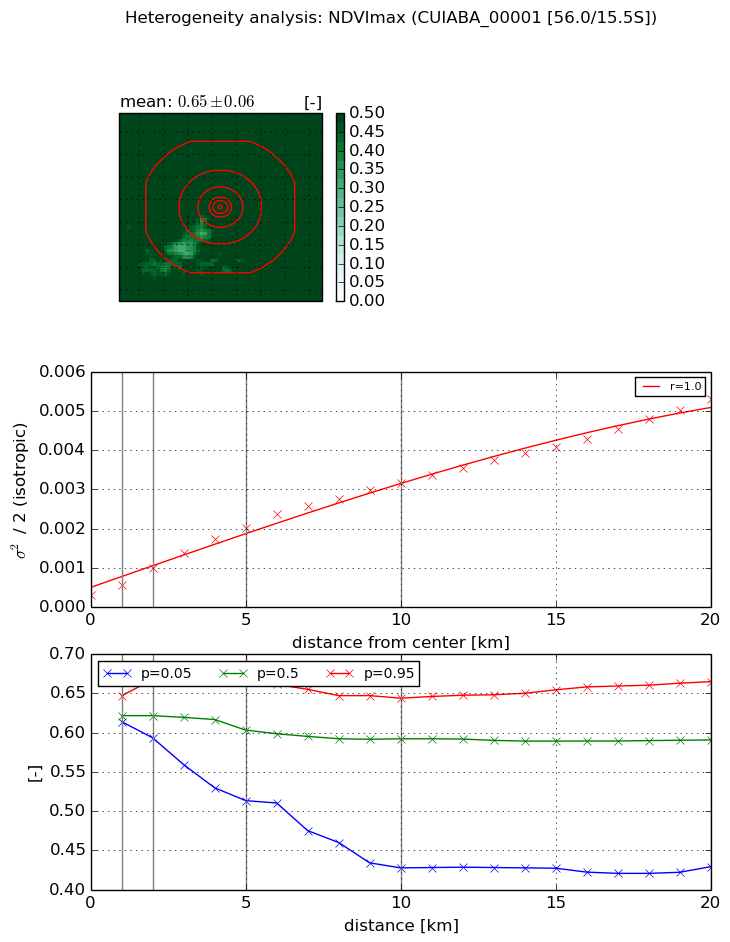
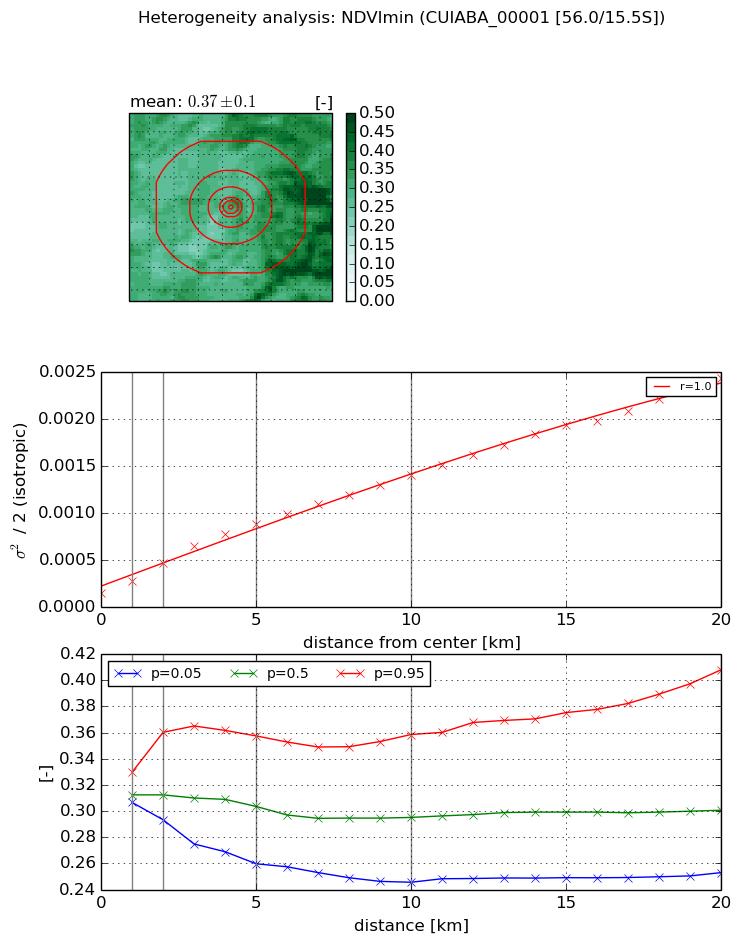
Heterogeneity analysis

The heterogeneity analysis provides information about the spatial and temporal heterogeneity of the site.

Topography


Roman et al. (2009) index


St

6.37005424435e-11

Rcv

0.116248241518

Rse

0.0

Rst

1.50053458547e-09

Rsv

47095360336.2


Height range @ 1km [m]

34

Height range @ 2km [m]

44

Height range @ 5km [m]

62

Height range @ 10km [m]

-999

Height range @ 20km [m]

-999


Variance slope @ 1 km

100

Variance slope @ 2 km

70

Variance slope @ 5 km

66

Variance slope @ 10 km

-999

Variance slope @ 20 km

-999


NDVI (max. NDVI composite)


Roman et al. (2009) index


St

1.34771584673e-05

Rcv

0.169026740993

Rse

0.0

Rst

0.331927058217

Rsv

222598.35082


NDVI range @ 1km [-]

0.03

NDVI range @ 2km [-]

0.07

NDVI range @ 5km [-]

0.15

NDVI range @ 10km [-]

0.22

NDVI range @ 20km [-]

0.24


Variance slope @ 1 km

0.000261890242236

Variance slope @ 2 km

0.000340521341825

Variance slope @ 5 km

0.000356406480861

Variance slope @ 10 km

0.000293587058636

Variance slope @ 20 km

0.000233444360628


NDVI (min. NDVI composite)I


Roman et al. (2009) index


St

0.000527675742073

Rcv

0.00236916536225

Rse

0.0

Rst

0.89951739771

Rsv

5684.40778527


NDVI range @ 1km [-]

0.02

NDVI range @ 2km [-]

0.07

NDVI range @ 5km [-]

0.1

NDVI range @ 10km [-]

0.11

NDVI range @ 20km [-]

0.16


NDVI slope @ 1 km

0.000126401086652

NDVI slope @ 2 km

0.000162791775148

NDVI slope @ 5 km

0.000153048662421

NDVI slope @ 10 km

0.000124187275736

NDVI slope @ 20 km

0.000109148885919


Temporal stability analysis

+000 deg (BHR)


BHR statistics

Temporal stability [1/decade]:


abs

rel


Weighted least square:

-99999.0


Ordinary least square:

-99999.0


Probabilities that GCOS criteria is met:

Weighted least square:

-99999.0 %

Ordinary least square:

-99999.0 %


DHR statistics

Temporal stability [1/decade]:


abs

rel


Weighted least square:

-99999.0


Ordinary least square:

-99999.0


Probabilities that GCOS criteria is met:

Weighted least square:

-99999.0 %

Ordinary least square:

-99999.0 %


+057/+063 deg (BHR)


BHR statistics

Temporal stability [1/decade]:


abs

rel


Weighted least square:

None


Ordinary least square:

None


Probabilities that GCOS criteria is met:

Weighted least square:

None %

Ordinary least square:

None %


DHR statistics

Temporal stability [1/decade]:


abs

rel


Weighted least square:

None


Ordinary least square:

None


Probabilities that GCOS criteria is met:

Weighted least square:

None %

Ordinary least square:

None %


Temporal anomaly analyis

The variance of the temporal anomalies provides an additional measure about the stability of the signal AFTER removal of the mean seasonal cylce.

+000 deg


+057/+063 deg