DALANZADGAD


Location

lon / lat [deg]: 104.4192 / 43.5772

Source network: AERONET


Geostationary surface albedo (GSA) data


“+000”


“+057/+063”


Landcover information (based on ESA CCI landcover data)


Landcover fractions @ 2km distance


Landcover fractions @ 20 km distance


Legend


Distance to open water bodies [km]:

24.9

Distance to urban areas [km]:

0.59


Radius: 1 km

Number of landcover classes:

2

Dominant landcover type:

200: bare areas

Fraction of dominant landcover type [%]:

89.0


Radius: 2 km

Number of landcover classes:

2

Dominant landcover type:

200: bare areas

Fraction of dominant landcover type [%]:

80.0


Radius: 5 km

Number of landcover classes:

3

Dominant landcover type:

200: bare areas

Fraction of dominant landcover type [%]:

85.0


Radius: 10 km

Number of landcover classes:

2

Dominant landcover type:

200: bare areas

Fraction of dominant landcover type [%]:

96.0


Radius: 20 km

Number of landcover classes:

2

Dominant landcover type:

200: bare areas

Fraction of dominant landcover type [%]:

97.0


Disturbances


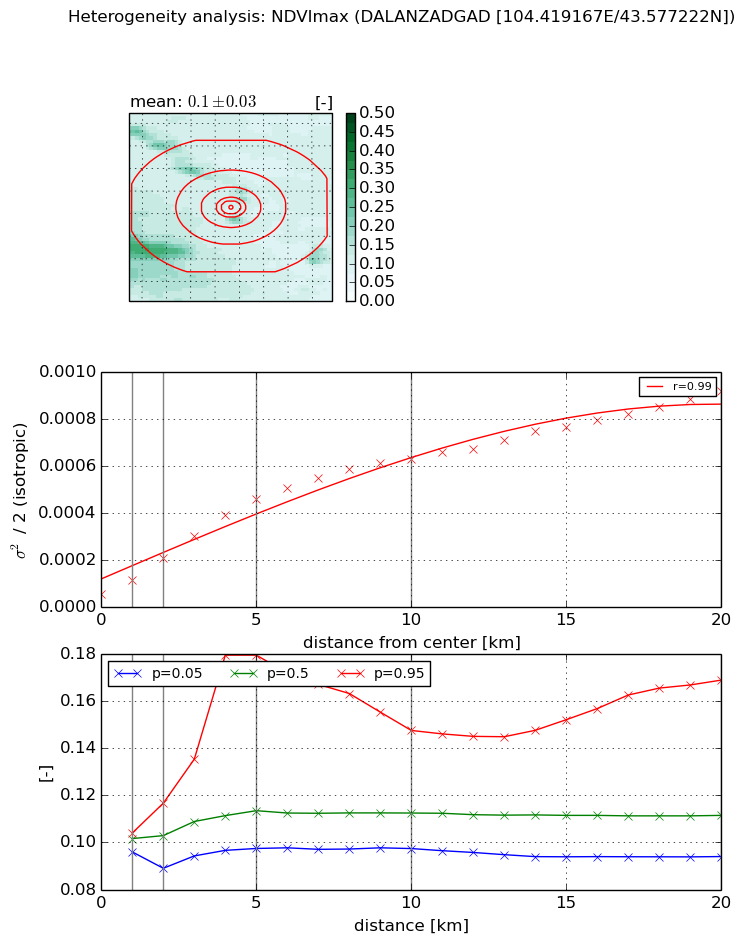
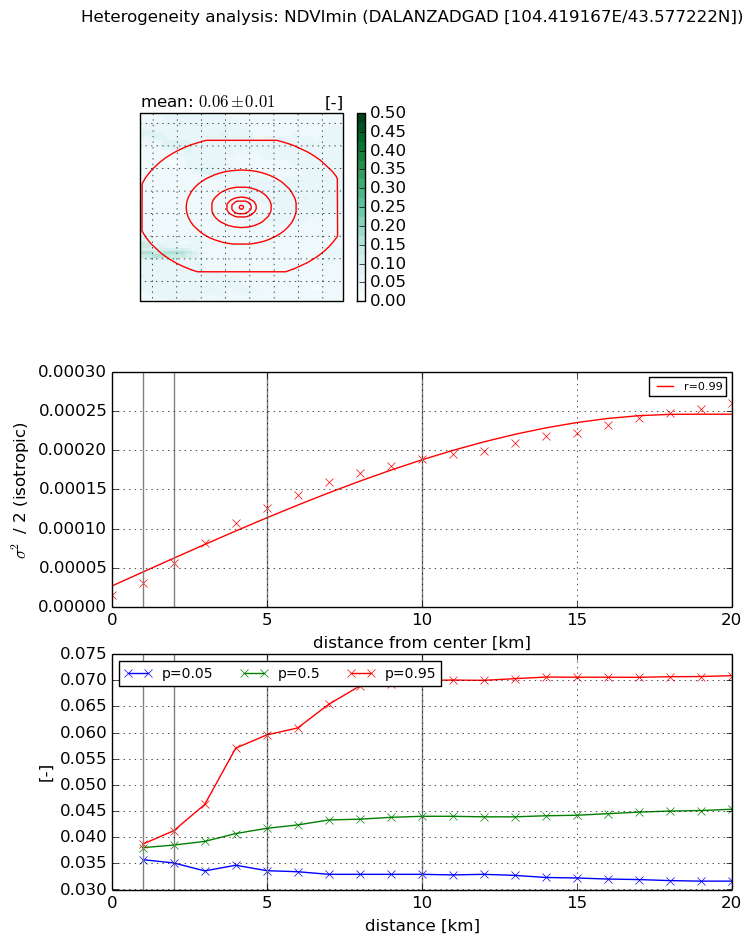
Heterogeneity analysis

The heterogeneity analysis provides information about the spatial and temporal heterogeneity of the site.

Topography


Roman et al. (2009) index


St

1.97170400493

Rcv

0.701214782706

Rse

0.0

Rst

-5.35359376929e-07

Rsv

-0.820311235866


Height range @ 1km [m]

20

Height range @ 2km [m]

39

Height range @ 5km [m]

103

Height range @ 10km [m]

-999

Height range @ 20km [m]

-999


Variance slope @ 1 km

44

Variance slope @ 2 km

86

Variance slope @ 5 km

209

Variance slope @ 10 km

-999

Variance slope @ 20 km

-999


NDVI (max. NDVI composite)


Roman et al. (2009) index


St

3.14465245702

Rcv

0.853296438318

Rse

0.0

Rst

0.0636051884703

Rsv

-0.0370988680219


NDVI range @ 1km [-]

0.01

NDVI range @ 2km [-]

0.03

NDVI range @ 5km [-]

0.08

NDVI range @ 10km [-]

0.05

NDVI range @ 20km [-]

0.07


Variance slope @ 1 km

6.03149638985e-05

Variance slope @ 2 km

7.70578871158e-05

Variance slope @ 5 km

8.39792079547e-05

Variance slope @ 10 km

5.99284347745e-05

Variance slope @ 20 km

3.87939971825e-05


NDVI (min. NDVI composite)I


Roman et al. (2009) index


St

1.67123093603

Rcv

0.78453313253

Rse

0.0

Rst

0.0105513496626

Rsv

-0.999999569526


NDVI range @ 1km [-]

0.0

NDVI range @ 2km [-]

0.01

NDVI range @ 5km [-]

0.03

NDVI range @ 10km [-]

0.04

NDVI range @ 20km [-]

0.04


NDVI slope @ 1 km

1.58553359231e-05

NDVI slope @ 2 km

2.08226120185e-05

NDVI slope @ 5 km

2.31730266521e-05

NDVI slope @ 10 km

1.82252090283e-05

NDVI slope @ 20 km

1.15030100912e-05


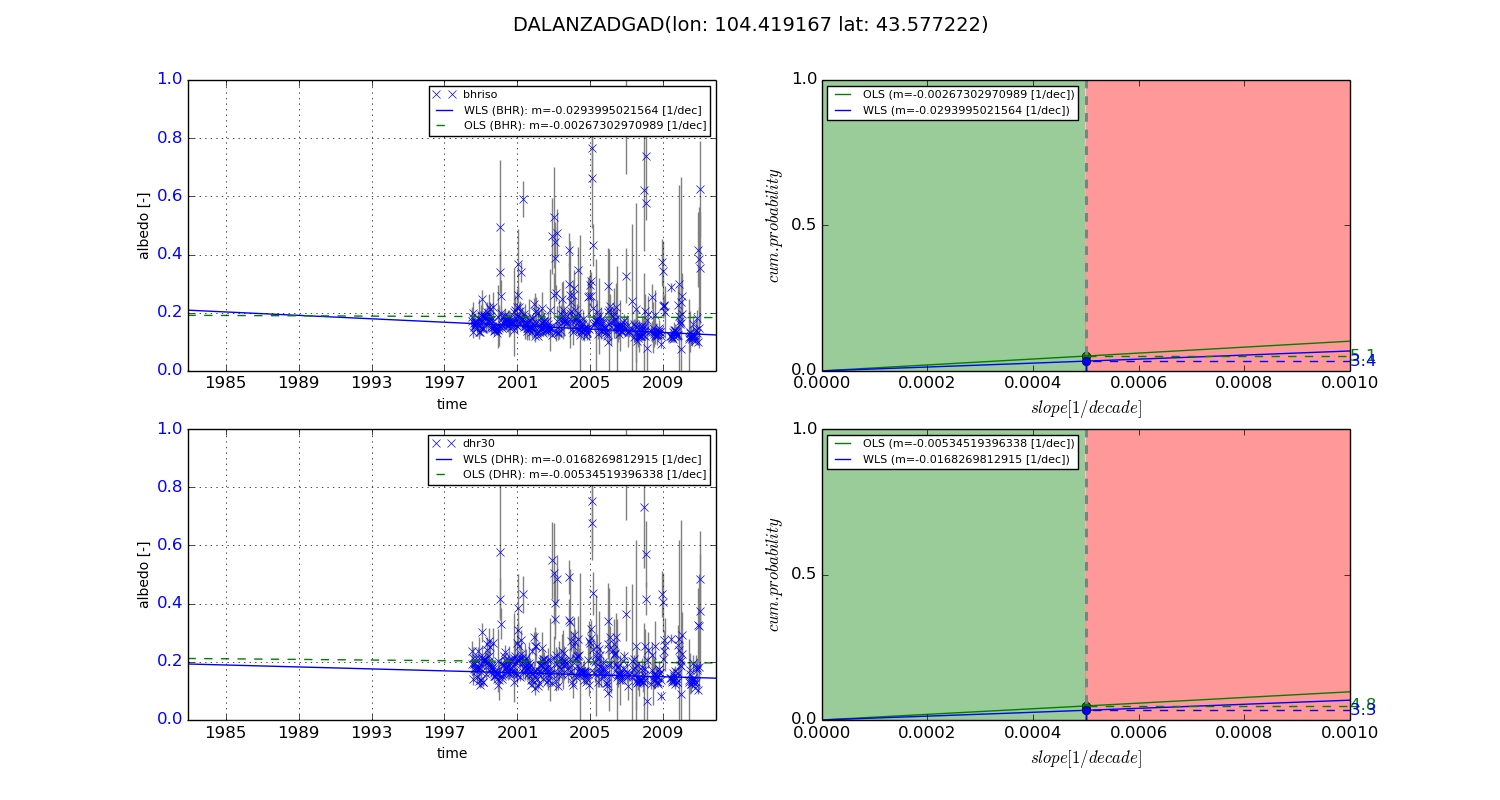
Temporal stability analysis

+000 deg (BHR)


BHR statistics

Temporal stability [1/decade]:


abs

rel


Weighted least square:

None


Ordinary least square:

None


Probabilities that GCOS criteria is met:

Weighted least square:

None %

Ordinary least square:

None %


DHR statistics

Temporal stability [1/decade]:


abs

rel


Weighted least square:

None


Ordinary least square:

None


Probabilities that GCOS criteria is met:

Weighted least square:

None %

Ordinary least square:

None %


+057/+063 deg (BHR)


BHR statistics

Temporal stability [1/decade]:


abs

rel


Weighted least square:

-0.0293995021564


Ordinary least square:

-0.00267302970989


Probabilities that GCOS criteria is met:

Weighted least square:

3.4 %

Ordinary least square:

5.1 %


DHR statistics

Temporal stability [1/decade]:


abs

rel


Weighted least square:

-0.0168269812915


Ordinary least square:

-0.00534519396338


Probabilities that GCOS criteria is met:

Weighted least square:

3.3 %

Ordinary least square:

4.8 %


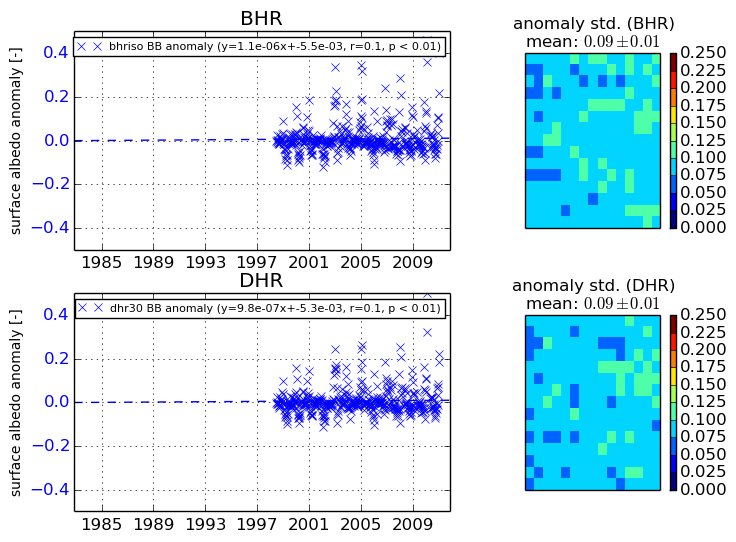
Temporal anomaly analyis

The variance of the temporal anomalies provides an additional measure about the stability of the signal AFTER removal of the mean seasonal cylce.

+000 deg


+057/+063 deg