DARK_DESERT_00001


Location

lon / lat [deg]: 40.129 / 26.352

Source network: ALBEDOVAL2


Geostationary surface albedo (GSA) data


“+000”


“+057/+063”


Landcover information (based on ESA CCI landcover data)


Landcover fractions @ 2km distance


Landcover fractions @ 20 km distance


Legend


Distance to open water bodies [km]:

none in region

Distance to urban areas [km]:

none in region


Radius: 1 km

Number of landcover classes:

1

Dominant landcover type:

200: bare areas

Fraction of dominant landcover type [%]:

100.0


Radius: 2 km

Number of landcover classes:

1

Dominant landcover type:

200: bare areas

Fraction of dominant landcover type [%]:

100.0


Radius: 5 km

Number of landcover classes:

1

Dominant landcover type:

200: bare areas

Fraction of dominant landcover type [%]:

100.0


Radius: 10 km

Number of landcover classes:

2

Dominant landcover type:

200: bare areas

Fraction of dominant landcover type [%]:

98.0


Radius: 20 km

Number of landcover classes:

2

Dominant landcover type:

200: bare areas

Fraction of dominant landcover type [%]:

99.0


Disturbances


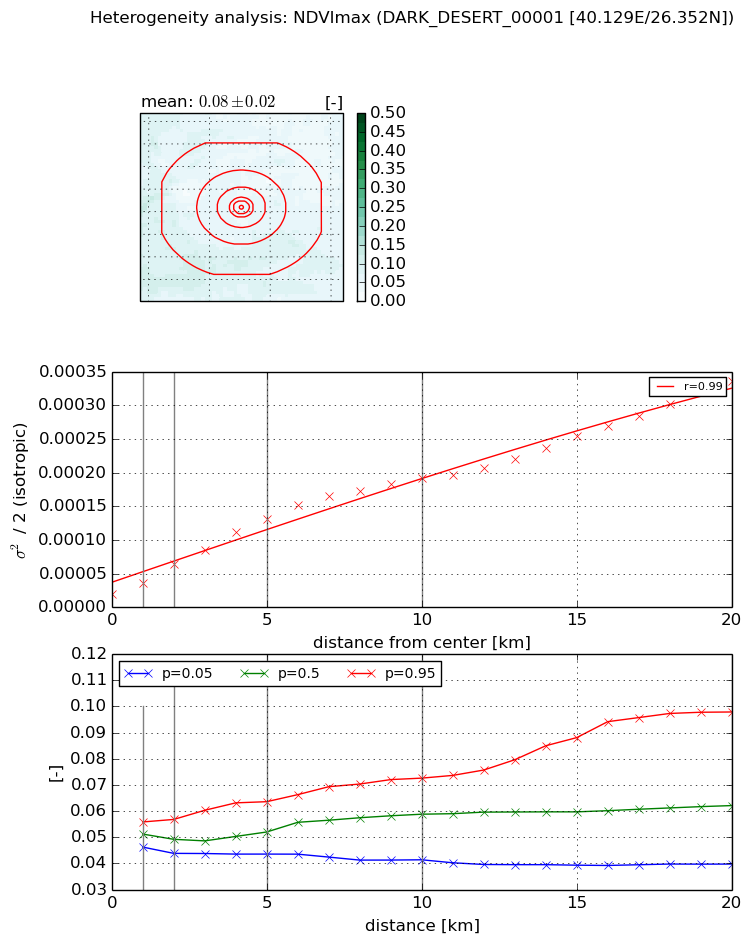
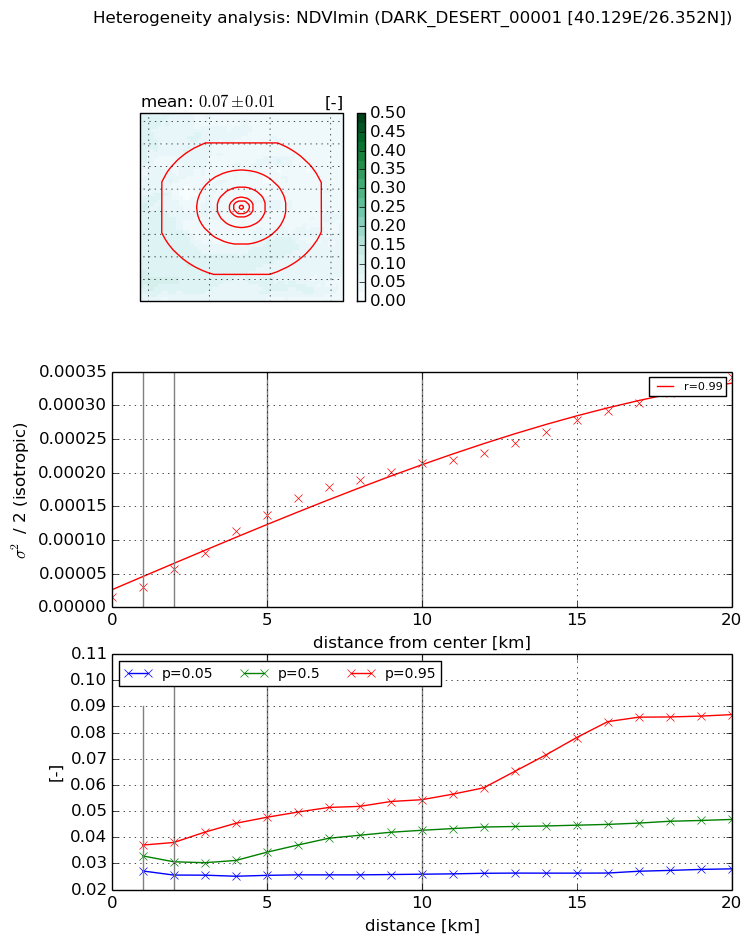
Heterogeneity analysis

The heterogeneity analysis provides information about the spatial and temporal heterogeneity of the site.

Topography


Roman et al. (2009) index


St

5.41323515719e-12

Rcv

0.616001944157

Rse

0.0

Rst

7.0657188318e-06

Rsv

5.54197243032e+11


Height range @ 1km [m]

30

Height range @ 2km [m]

41

Height range @ 5km [m]

90

Height range @ 10km [m]

-999

Height range @ 20km [m]

-999


Variance slope @ 1 km

189

Variance slope @ 2 km

131

Variance slope @ 5 km

165

Variance slope @ 10 km

-999

Variance slope @ 20 km

-999


NDVI (max. NDVI composite)


Roman et al. (2009) index


St

4.09069197048e-08

Rcv

0.07848257712

Rse

0.0

Rst

0.285053440179

Rsv

73337225.2611


NDVI range @ 1km [-]

0.01

NDVI range @ 2km [-]

0.01

NDVI range @ 5km [-]

0.02

NDVI range @ 10km [-]

0.03

NDVI range @ 20km [-]

0.06


Variance slope @ 1 km

1.62302775196e-05

Variance slope @ 2 km

2.20635309904e-05

Variance slope @ 5 km

2.29608515525e-05

Variance slope @ 10 km

1.80001583617e-05

Variance slope @ 20 km

1.45489437725e-05


NDVI (min. NDVI composite)I


Roman et al. (2009) index


St

4.0170036321e-08

Rcv

0.103338843573

Rse

0.0

Rst

0.373732798983

Rsv

74682530.9507


NDVI range @ 1km [-]

0.01

NDVI range @ 2km [-]

0.01

NDVI range @ 5km [-]

0.02

NDVI range @ 10km [-]

0.03

NDVI range @ 20km [-]

0.06


NDVI slope @ 1 km

1.4263655309e-05

NDVI slope @ 2 km

2.07529245071e-05

NDVI slope @ 5 km

2.52112666955e-05

NDVI slope @ 10 km

2.10986033708e-05

NDVI slope @ 20 km

1.57388498998e-05


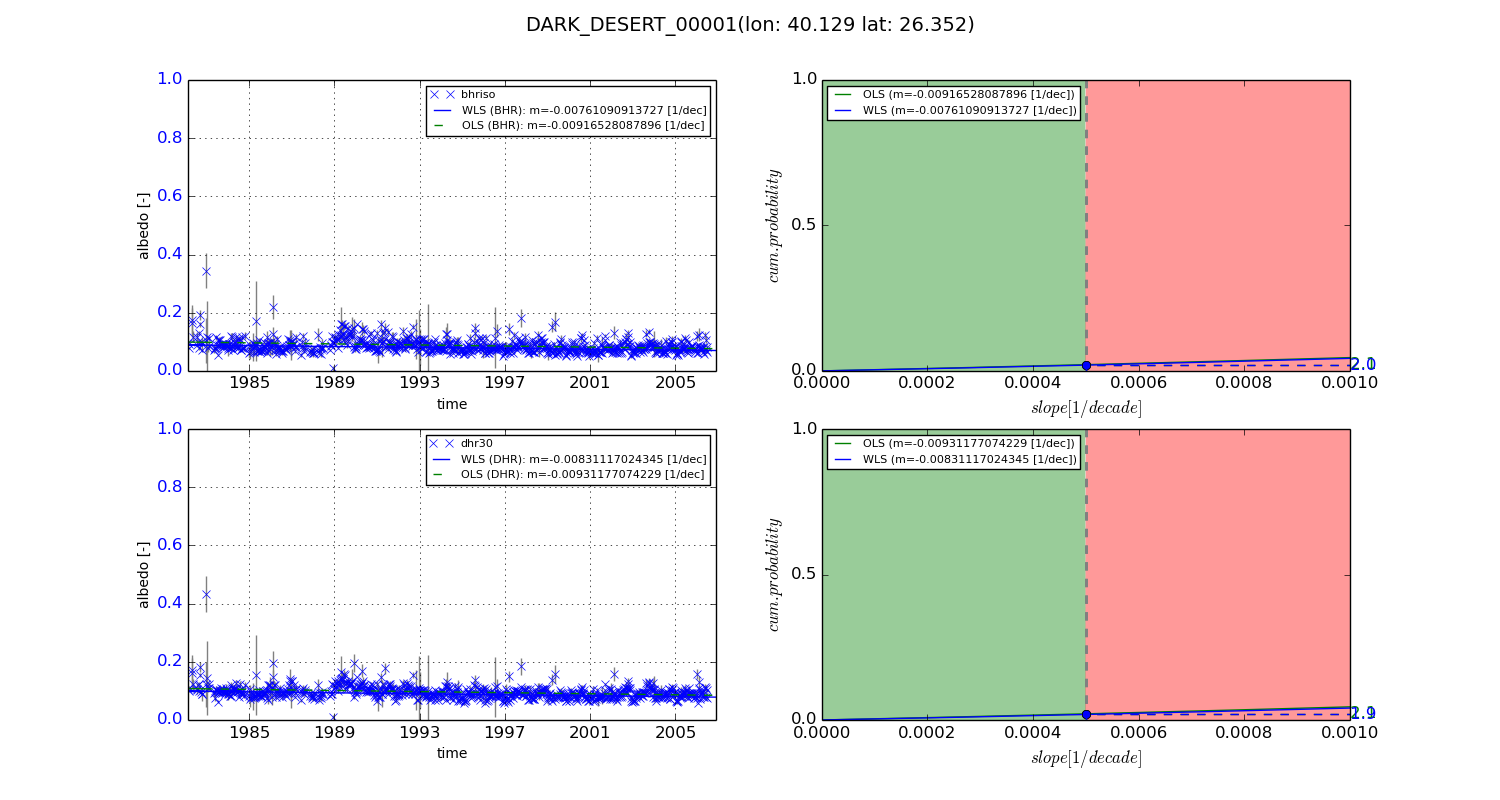
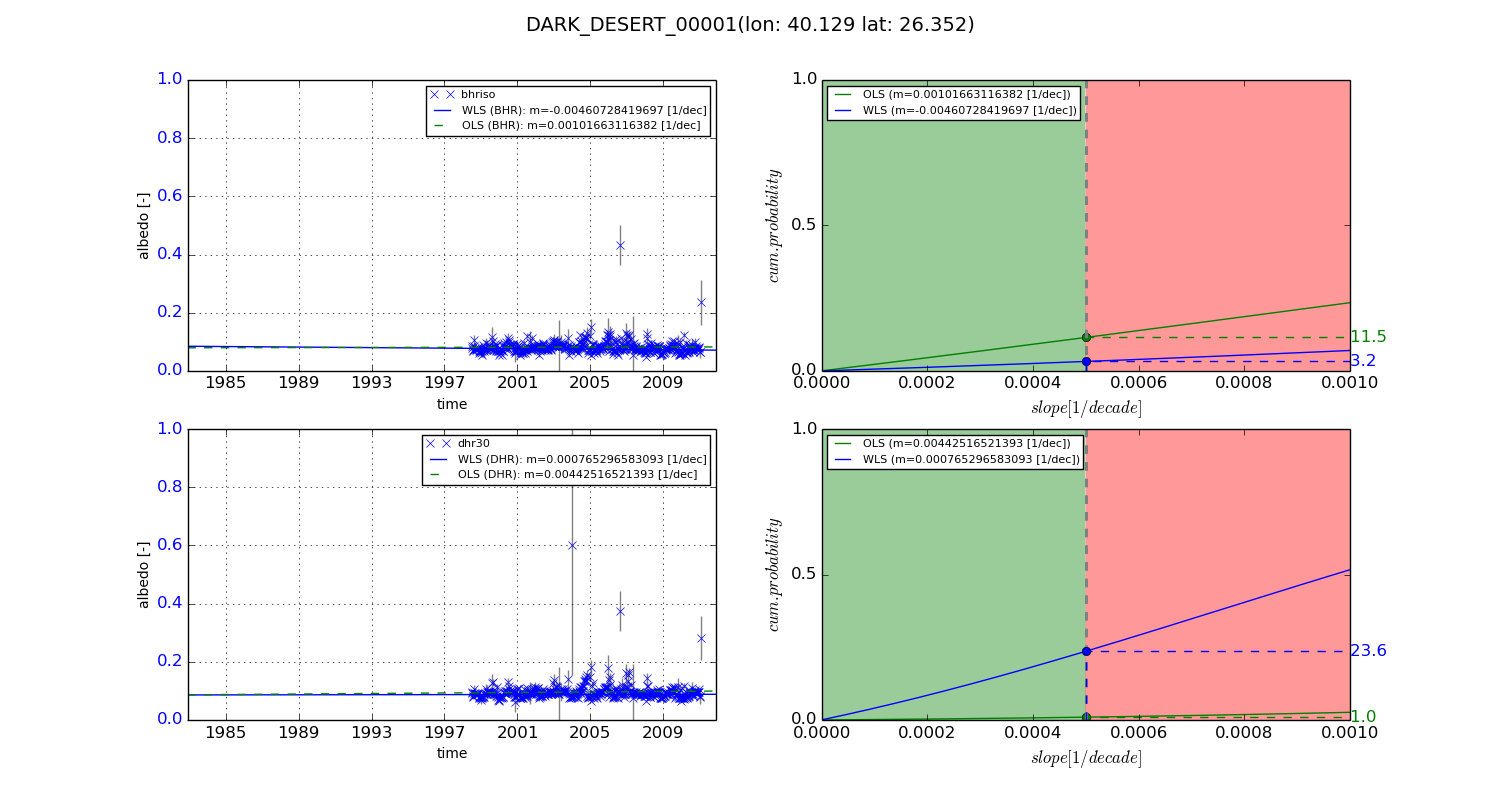
Temporal stability analysis

+000 deg (BHR)


BHR statistics

Temporal stability [1/decade]:


abs

rel


Weighted least square:

-0.00761090913727


Ordinary least square:

-0.00916528087896


Probabilities that GCOS criteria is met:

Weighted least square:

2.0 %

Ordinary least square:

2.1 %


DHR statistics

Temporal stability [1/decade]:


abs

rel


Weighted least square:

-0.00831117024345


Ordinary least square:

-0.00931177074229


Probabilities that GCOS criteria is met:

Weighted least square:

1.9 %

Ordinary least square:

2.1 %


+057/+063 deg (BHR)


BHR statistics

Temporal stability [1/decade]:


abs

rel


Weighted least square:

-0.00460728419697


Ordinary least square:

0.00101663116382


Probabilities that GCOS criteria is met:

Weighted least square:

3.2 %

Ordinary least square:

11.5 %


DHR statistics

Temporal stability [1/decade]:


abs

rel


Weighted least square:

0.000765296583093


Ordinary least square:

0.00442516521393


Probabilities that GCOS criteria is met:

Weighted least square:

23.6 %

Ordinary least square:

1.0 %


Temporal anomaly analyis

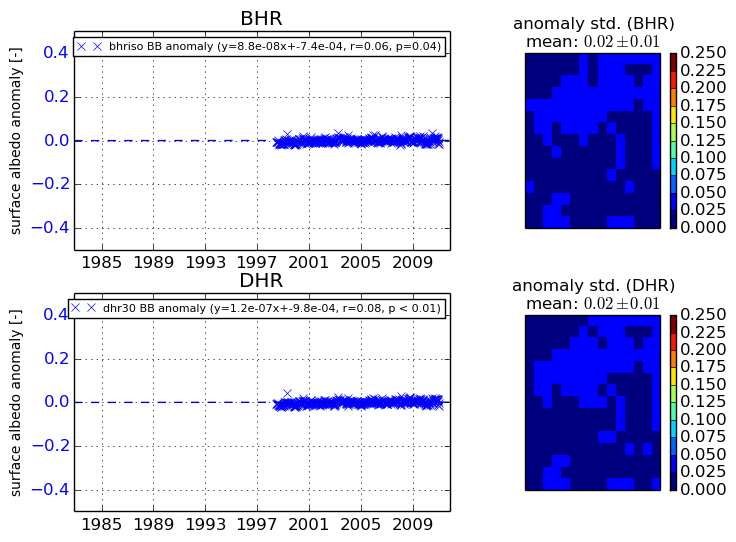
The variance of the temporal anomalies provides an additional measure about the stability of the signal AFTER removal of the mean seasonal cylce.
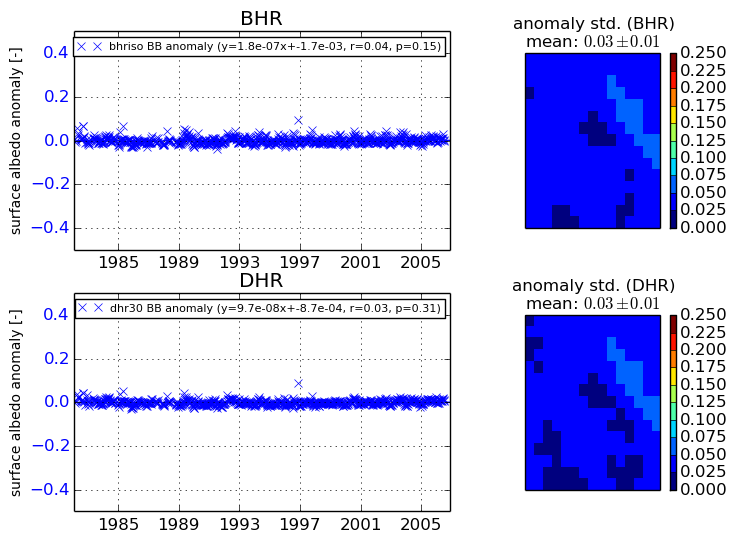
+000 deg


+057/+063 deg