DARK_DESERT_00002


Location

lon / lat [deg]: 39.871 / 26.375

Source network: ALBEDOVAL2


Geostationary surface albedo (GSA) data


“+000”


“+057/+063”


Landcover information (based on ESA CCI landcover data)


Landcover fractions @ 2km distance


Landcover fractions @ 20 km distance


Legend


Distance to open water bodies [km]:

none in region

Distance to urban areas [km]:

none in region


Radius: 1 km

Number of landcover classes:

1

Dominant landcover type:

200: bare areas

Fraction of dominant landcover type [%]:

100.0


Radius: 2 km

Number of landcover classes:

1

Dominant landcover type:

200: bare areas

Fraction of dominant landcover type [%]:

100.0


Radius: 5 km

Number of landcover classes:

2

Dominant landcover type:

200: bare areas

Fraction of dominant landcover type [%]:

97.0


Radius: 10 km

Number of landcover classes:

2

Dominant landcover type:

200: bare areas

Fraction of dominant landcover type [%]:

93.0


Radius: 20 km

Number of landcover classes:

2

Dominant landcover type:

200: bare areas

Fraction of dominant landcover type [%]:

98.0


Disturbances


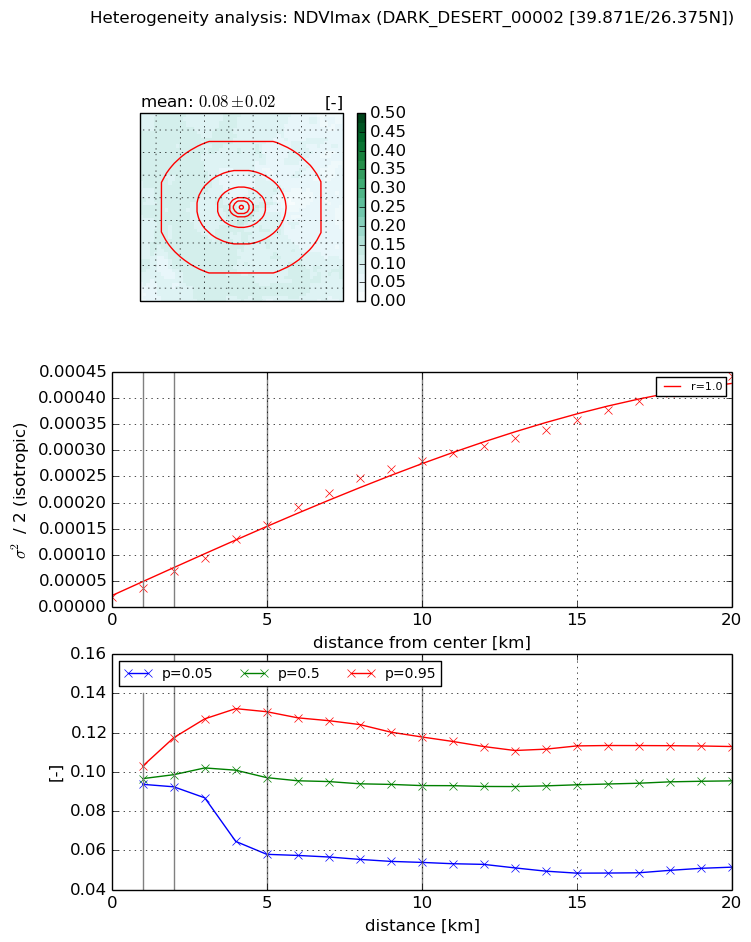
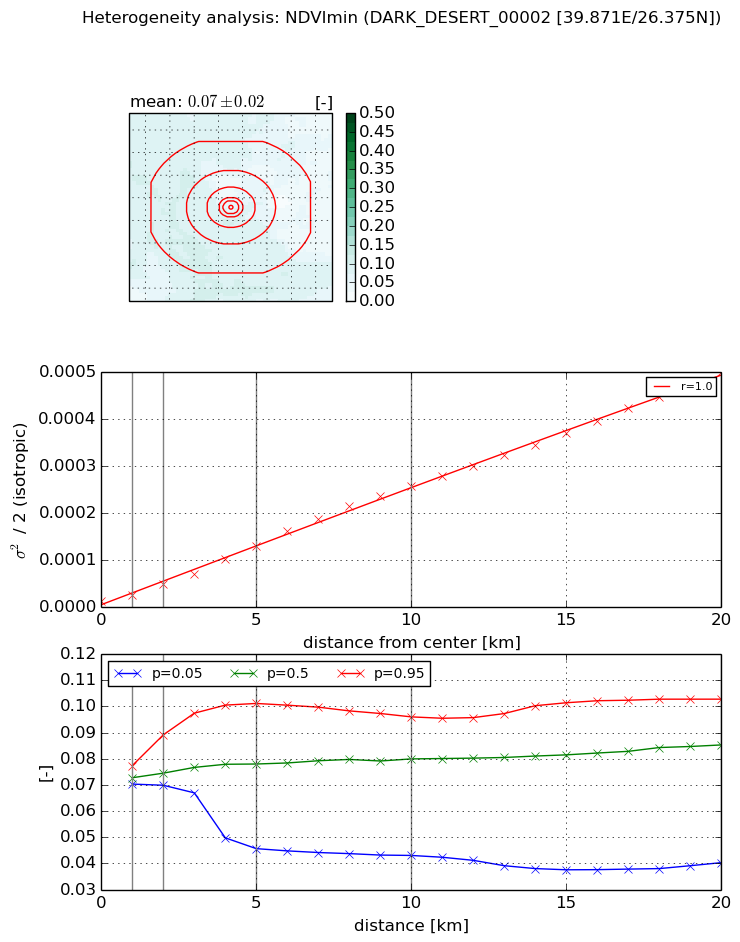
Heterogeneity analysis

The heterogeneity analysis provides information about the spatial and temporal heterogeneity of the site.

Topography


Roman et al. (2009) index


St

2.91610256725

Rcv

-0.0318038463771

Rse

0.0

Rst

-4.01805203718e-05

Rsv

0.996926371542


Height range @ 1km [m]

109

Height range @ 2km [m]

137

Height range @ 5km [m]

147

Height range @ 10km [m]

-999

Height range @ 20km [m]

-999


Variance slope @ 1 km

338

Variance slope @ 2 km

557

Variance slope @ 5 km

757

Variance slope @ 10 km

-999

Variance slope @ 20 km

-999


NDVI (max. NDVI composite)


Roman et al. (2009) index


St

2.57872643708

Rcv

0.550084427178

Rse

0.0

Rst

-0.000412029687406

Rsv

0.612868511542


NDVI range @ 1km [-]

0.01

NDVI range @ 2km [-]

0.03

NDVI range @ 5km [-]

0.07

NDVI range @ 10km [-]

0.06

NDVI range @ 20km [-]

0.06


Variance slope @ 1 km

1.71566087881e-05

Variance slope @ 2 km

2.49978488973e-05

Variance slope @ 5 km

2.85221442408e-05

Variance slope @ 10 km

2.77559878923e-05

Variance slope @ 20 km

2.08563608904e-05


NDVI (min. NDVI composite)I


Roman et al. (2009) index


St

1.60338312801

Rcv

0.678663743794

Rse

0.0

Rst

-0.192380121834

Rsv

-0.999999896519


NDVI range @ 1km [-]

0.01

NDVI range @ 2km [-]

0.02

NDVI range @ 5km [-]

0.06

NDVI range @ 10km [-]

0.05

NDVI range @ 20km [-]

0.06


NDVI slope @ 1 km

1.20513588475e-05

NDVI slope @ 2 km

1.85347896878e-05

NDVI slope @ 5 km

2.38997368575e-05

NDVI slope @ 10 km

2.5919416038e-05

NDVI slope @ 20 km

2.44489523399e-05


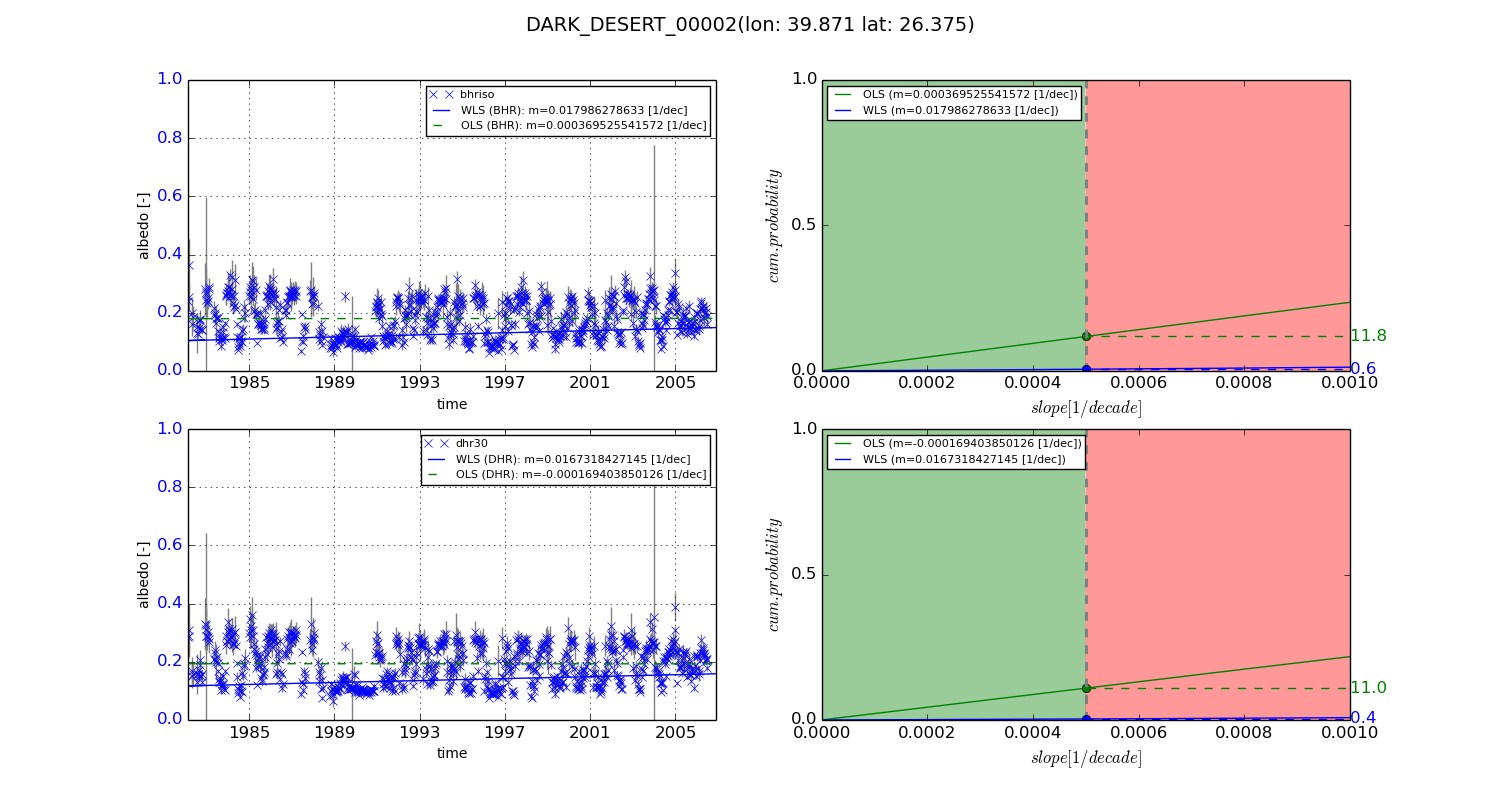
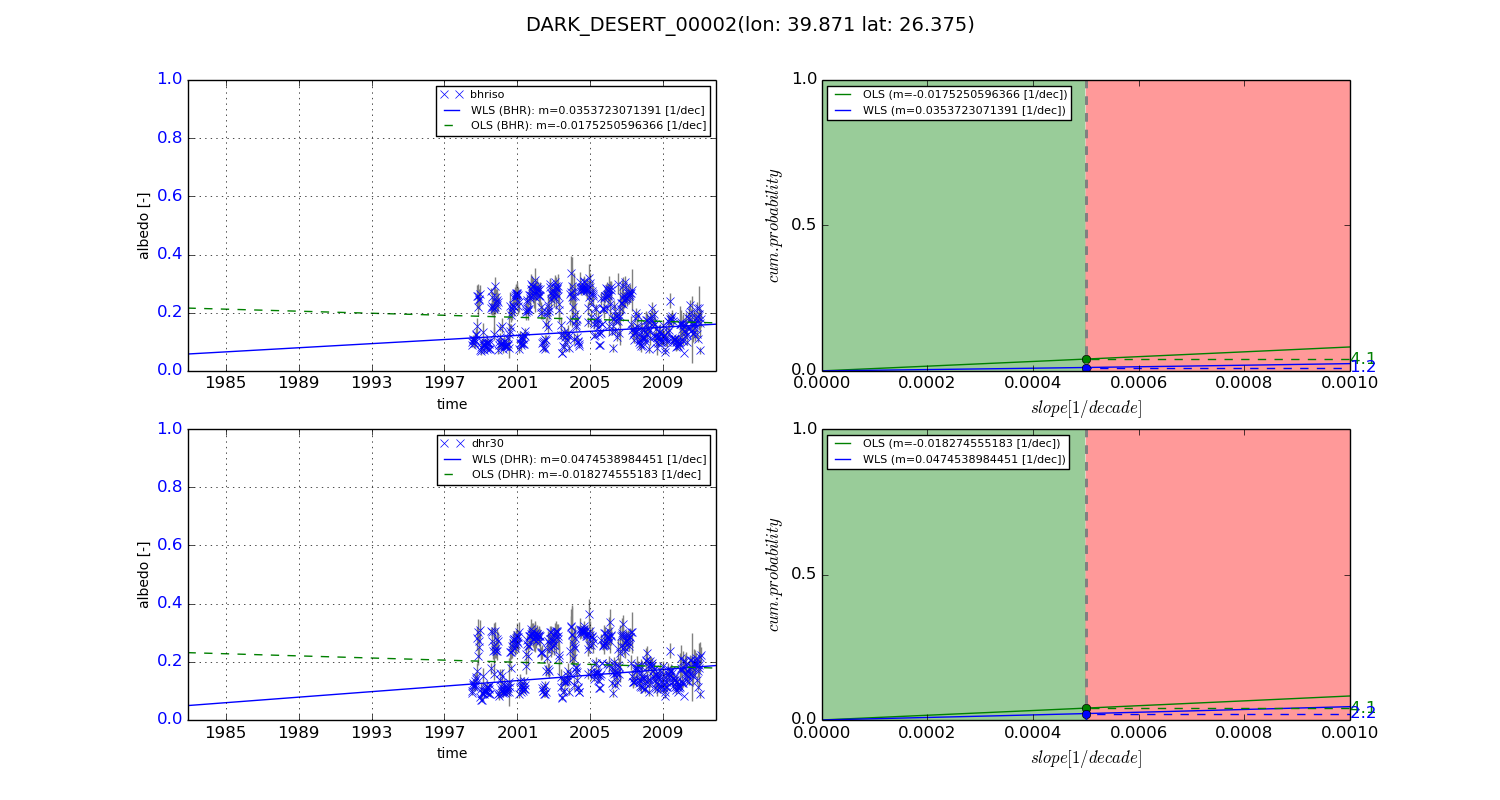
Temporal stability analysis

+000 deg (BHR)


BHR statistics

Temporal stability [1/decade]:


abs

rel


Weighted least square:

0.017986278633


Ordinary least square:

0.000369525541572


Probabilities that GCOS criteria is met:

Weighted least square:

0.6 %

Ordinary least square:

11.8 %


DHR statistics

Temporal stability [1/decade]:


abs

rel


Weighted least square:

0.0167318427145


Ordinary least square:

-0.000169403850126


Probabilities that GCOS criteria is met:

Weighted least square:

0.4 %

Ordinary least square:

11.0 %


+057/+063 deg (BHR)


BHR statistics

Temporal stability [1/decade]:


abs

rel


Weighted least square:

0.0353723071391


Ordinary least square:

-0.0175250596366


Probabilities that GCOS criteria is met:

Weighted least square:

1.2 %

Ordinary least square:

4.1 %


DHR statistics

Temporal stability [1/decade]:


abs

rel


Weighted least square:

0.0474538984451


Ordinary least square:

-0.018274555183


Probabilities that GCOS criteria is met:

Weighted least square:

2.2 %

Ordinary least square:

4.1 %


Temporal anomaly analyis

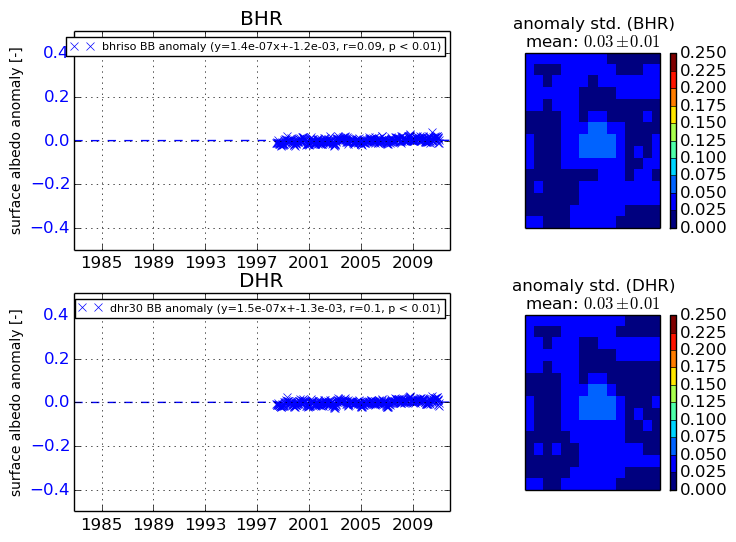
The variance of the temporal anomalies provides an additional measure about the stability of the signal AFTER removal of the mean seasonal cylce.
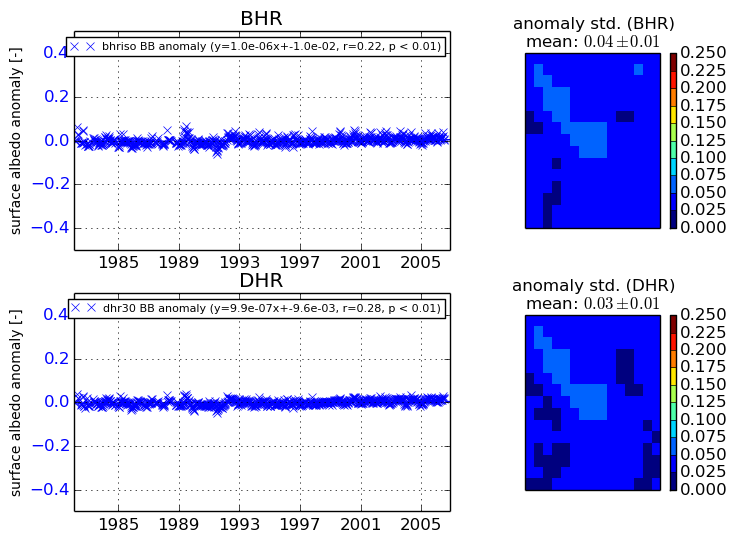
+000 deg


+057/+063 deg