DAYTON


Location

lon / lat [deg]: -84.1096 / 39.776

Source network: AERONET


Geostationary surface albedo (GSA) data


“+000”


“+057/+063”


Landcover information (based on ESA CCI landcover data)


Landcover fractions @ 2km distance


Landcover fractions @ 20 km distance


Legend


Distance to open water bodies [km]:

1.37

Distance to urban areas [km]:

0.36


Radius: 1 km

Number of landcover classes:

3

Dominant landcover type:

190: urban areas

Fraction of dominant landcover type [%]:

52.0


Radius: 2 km

Number of landcover classes:

3

Dominant landcover type:

190: urban areas

Fraction of dominant landcover type [%]:

82.0


Radius: 5 km

Number of landcover classes:

4

Dominant landcover type:

190: urban areas

Fraction of dominant landcover type [%]:

82.0


Radius: 10 km

Number of landcover classes:

5

Dominant landcover type:

190: urban areas

Fraction of dominant landcover type [%]:

79.0


Radius: 20 km

Number of landcover classes:

4

Dominant landcover type:

190: urban areas

Fraction of dominant landcover type [%]:

49.0


Disturbances


Heterogeneity analysis

The heterogeneity analysis provides information about the spatial and temporal heterogeneity of the site.

Topography


Roman et al. (2009) index


St

0.0670847361691

Rcv

0.111120809634

Rse

0.0

Rst

1.39854159796e-05

Rsv

44.6084269312


Height range @ 1km [m]

11

Height range @ 2km [m]

33

Height range @ 5km [m]

71

Height range @ 10km [m]

-999

Height range @ 20km [m]

-999


Variance slope @ 1 km

91

Variance slope @ 2 km

118

Variance slope @ 5 km

121

Variance slope @ 10 km

-999

Variance slope @ 20 km

-999


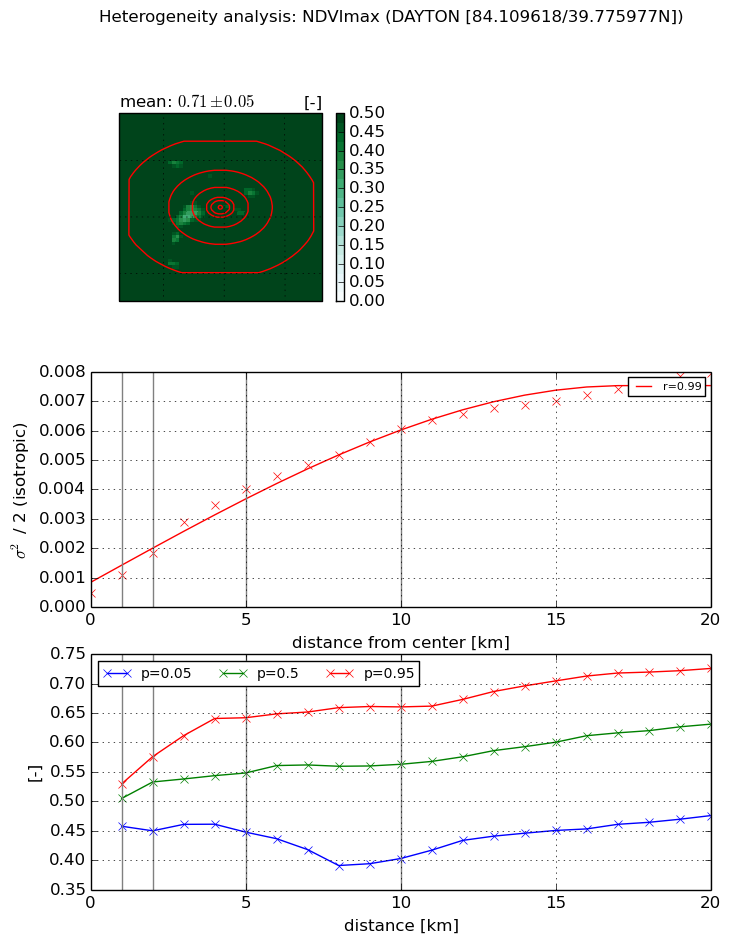
NDVI (max. NDVI composite)


Roman et al. (2009) index


St

1.15796743941

Rcv

0.380543143842

Rse

0.0

Rst

-0.341157070277

Rsv

1.8690462075


NDVI range @ 1km [-]

0.07

NDVI range @ 2km [-]

0.13

NDVI range @ 5km [-]

0.19

NDVI range @ 10km [-]

0.26

NDVI range @ 20km [-]

0.25


Variance slope @ 1 km

0.000620060827897

Variance slope @ 2 km

0.000679194656414

Variance slope @ 5 km

0.000741516240145

Variance slope @ 10 km

0.00055331263617

Variance slope @ 20 km

0.000350487474514


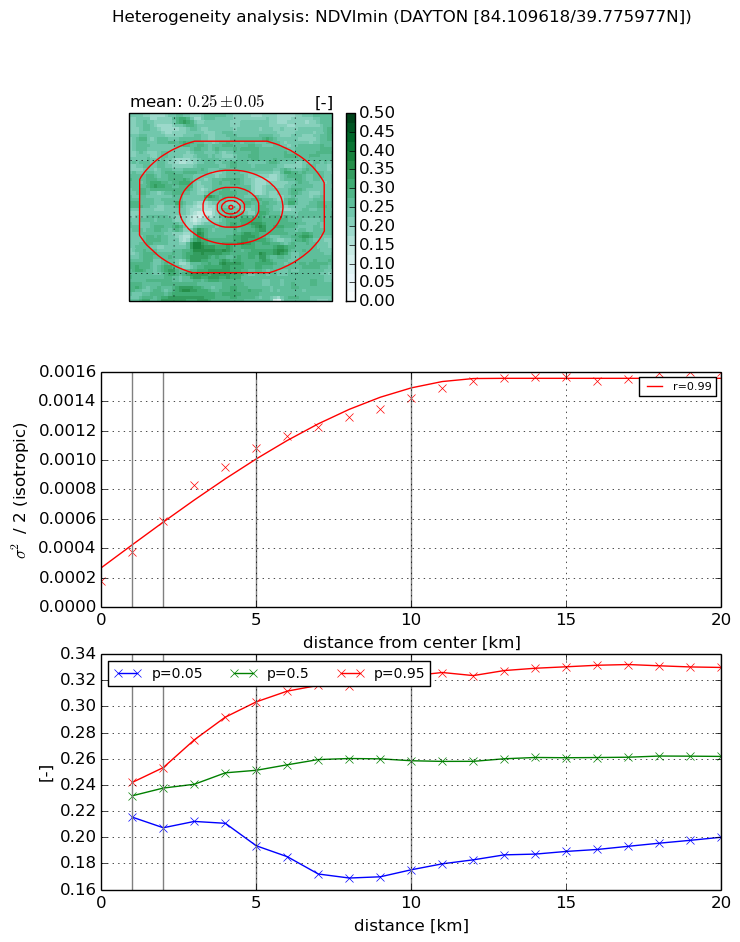
NDVI (min. NDVI composite)I


Roman et al. (2009) index


St

1.67323865147

Rcv

0.80360755292

Rse

0.0

Rst

-0.130649065077

Rsv

0.858673516249


NDVI range @ 1km [-]

0.03

NDVI range @ 2km [-]

0.05

NDVI range @ 5km [-]

0.11

NDVI range @ 10km [-]

0.15

NDVI range @ 20km [-]

0.13


NDVI slope @ 1 km

0.000196137331802

NDVI slope @ 2 km

0.000204771630604

NDVI slope @ 5 km

0.000184747341874

NDVI slope @ 10 km

0.000120333281802

NDVI slope @ 20 km

6.15495139224e-05


Temporal stability analysis

+000 deg (BHR)


BHR statistics

Temporal stability [1/decade]:


abs

rel


Weighted least square:

None


Ordinary least square:

None


Probabilities that GCOS criteria is met:

Weighted least square:

None %

Ordinary least square:

None %


DHR statistics

Temporal stability [1/decade]:


abs

rel


Weighted least square:

None


Ordinary least square:

None


Probabilities that GCOS criteria is met:

Weighted least square:

None %

Ordinary least square:

None %


+057/+063 deg (BHR)


BHR statistics

Temporal stability [1/decade]:


abs

rel


Weighted least square:

None


Ordinary least square:

None


Probabilities that GCOS criteria is met:

Weighted least square:

None %

Ordinary least square:

None %


DHR statistics

Temporal stability [1/decade]:


abs

rel


Weighted least square:

None


Ordinary least square:

None


Probabilities that GCOS criteria is met:

Weighted least square:

None %

Ordinary least square:

None %


Temporal anomaly analyis

The variance of the temporal anomalies provides an additional measure about the stability of the signal AFTER removal of the mean seasonal cylce.

+000 deg


+057/+063 deg