DE-BAY


Location

lon / lat [deg]: 11.8669 / 50.1419

Source network: FLUXNET


Geostationary surface albedo (GSA) data


“+000”


“+057/+063”


Landcover information (based on ESA CCI landcover data)


Landcover fractions @ 2km distance


Landcover fractions @ 20 km distance


Legend


Distance to open water bodies [km]:

3.93

Distance to urban areas [km]:

1.4


Radius: 1 km

Number of landcover classes:

2

Dominant landcover type:

70: Tree cover, needleleaved, evergreen, closed to open (>15%)

Fraction of dominant landcover type [%]:

96.0


Radius: 2 km

Number of landcover classes:

3

Dominant landcover type:

70: Tree cover, needleleaved, evergreen, closed to open (>15%)

Fraction of dominant landcover type [%]:

92.0


Radius: 5 km

Number of landcover classes:

7

Dominant landcover type:

70: Tree cover, needleleaved, evergreen, closed to open (>15%)

Fraction of dominant landcover type [%]:

51.0


Radius: 10 km

Number of landcover classes:

5

Dominant landcover type:

10: cropland, rainfed

Fraction of dominant landcover type [%]:

44.0


Radius: 20 km

Number of landcover classes:

6

Dominant landcover type:

70: Tree cover, needleleaved, evergreen, closed to open (>15%)

Fraction of dominant landcover type [%]:

44.0


Disturbances


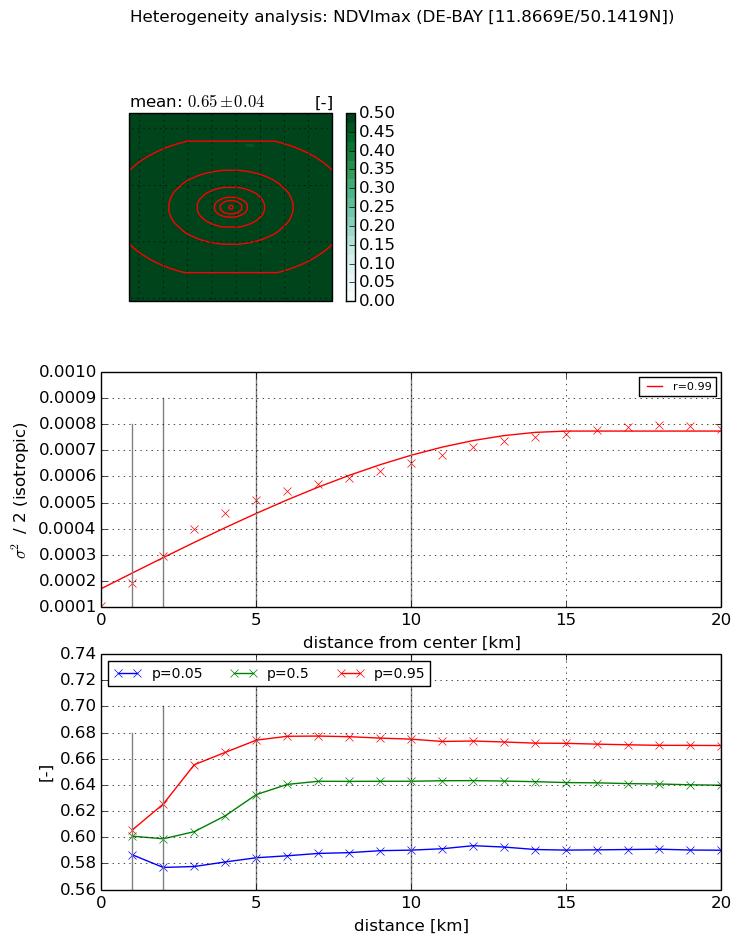
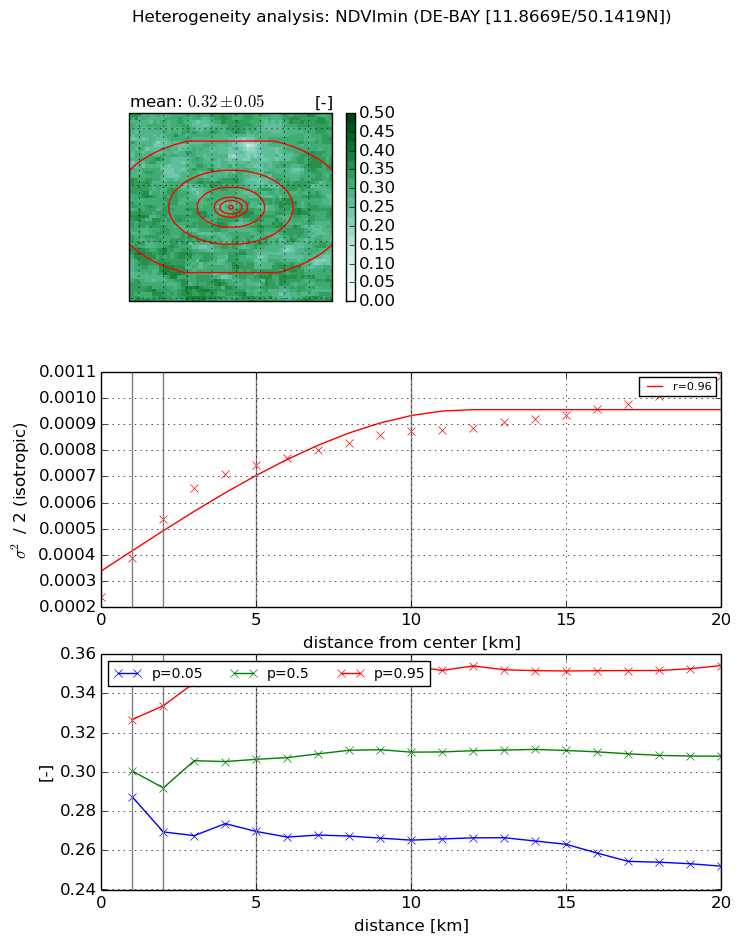
Heterogeneity analysis

The heterogeneity analysis provides information about the spatial and temporal heterogeneity of the site.

Topography


Roman et al. (2009) index


St

5.99261192724

Rcv

0.113023092861

Rse

0.0

Rst

0.0135825930241

Rsv

0.374010745885


Height range @ 1km [m]

99

Height range @ 2km [m]

224

Height range @ 5km [m]

256

Height range @ 10km [m]

-999

Height range @ 20km [m]

-999


Variance slope @ 1 km

1173

Variance slope @ 2 km

1679

Variance slope @ 5 km

2104

Variance slope @ 10 km

-999

Variance slope @ 20 km

-999


NDVI (max. NDVI composite)


Roman et al. (2009) index


St

6.45956740201e-07

Rcv

0.0877264426695

Rse

0.0

Rst

0.301705012673

Rsv

4644273.4656


NDVI range @ 1km [-]

0.02

NDVI range @ 2km [-]

0.05

NDVI range @ 5km [-]

0.09

NDVI range @ 10km [-]

0.08

NDVI range @ 20km [-]

0.08


Variance slope @ 1 km

8.77184476743e-05

Variance slope @ 2 km

9.53906303795e-05

Variance slope @ 5 km

8.33016064261e-05

Variance slope @ 10 km

5.23100250054e-05

Variance slope @ 20 km

3.08062151818e-05


NDVI (min. NDVI composite)I


Roman et al. (2009) index


St

nan

Rcv

nan

Rse

nan

Rst

nan

Rsv

nan


NDVI range @ 1km [-]

0.04

NDVI range @ 2km [-]

0.06

NDVI range @ 5km [-]

0.08

NDVI range @ 10km [-]

0.09

NDVI range @ 20km [-]

0.1


NDVI slope @ 1 km

0.000147896188684

NDVI slope @ 2 km

0.000149239841076

NDVI slope @ 5 km

0.000102864647587

NDVI slope @ 10 km

5.71187732339e-05

NDVI slope @ 20 km

3.10622019417e-05


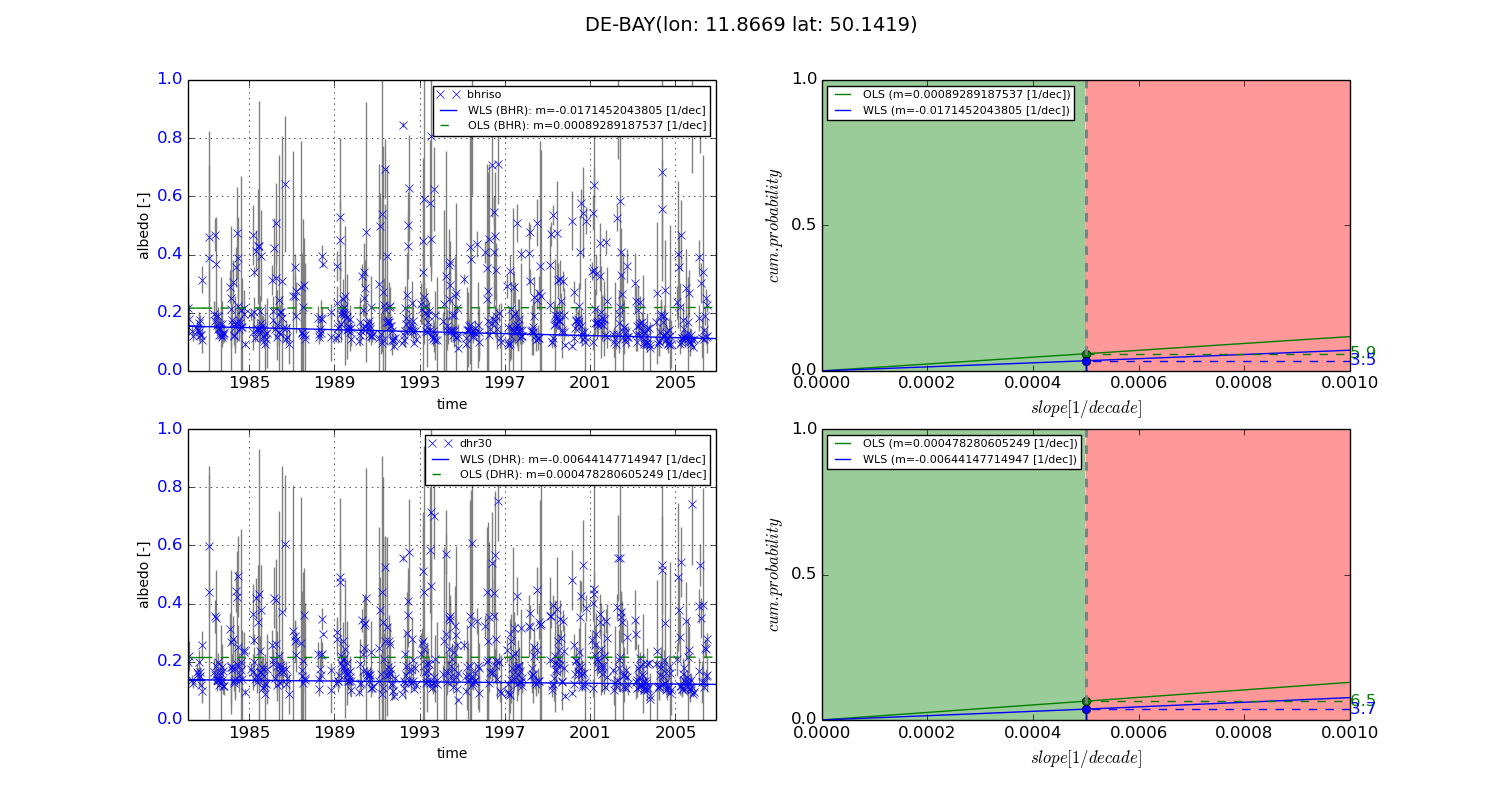
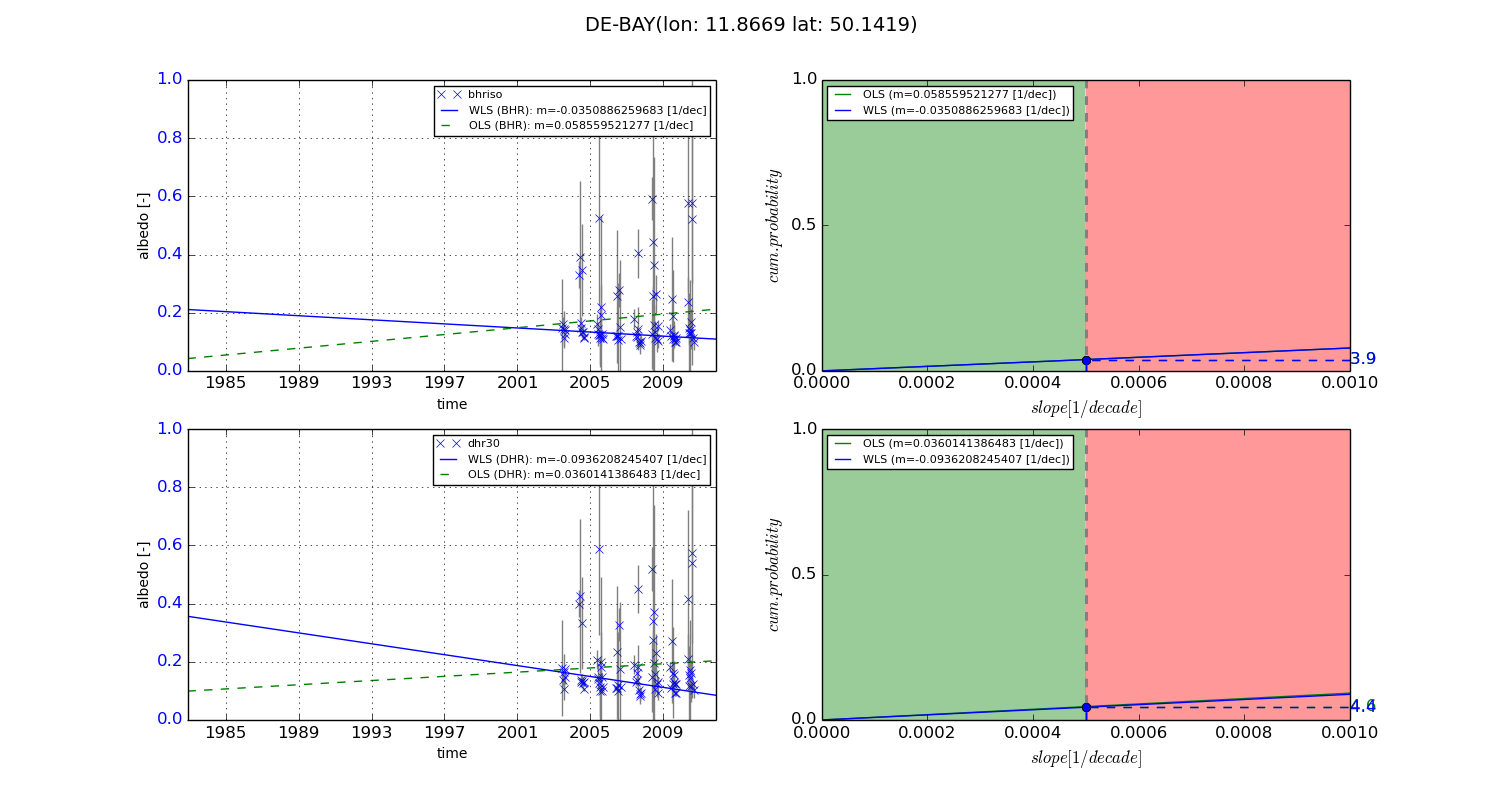
Temporal stability analysis

+000 deg (BHR)


BHR statistics

Temporal stability [1/decade]:


abs

rel


Weighted least square:

-0.0171452043805


Ordinary least square:

0.00089289187537


Probabilities that GCOS criteria is met:

Weighted least square:

3.5 %

Ordinary least square:

5.9 %


DHR statistics

Temporal stability [1/decade]:


abs

rel


Weighted least square:

-0.00644147714947


Ordinary least square:

0.000478280605249


Probabilities that GCOS criteria is met:

Weighted least square:

3.7 %

Ordinary least square:

6.5 %


+057/+063 deg (BHR)


BHR statistics

Temporal stability [1/decade]:


abs

rel


Weighted least square:

-0.0350886259683


Ordinary least square:

0.058559521277


Probabilities that GCOS criteria is met:

Weighted least square:

3.9 %

Ordinary least square:

3.9 %


DHR statistics

Temporal stability [1/decade]:


abs

rel


Weighted least square:

-0.0936208245407


Ordinary least square:

0.0360141386483


Probabilities that GCOS criteria is met:

Weighted least square:

4.4 %

Ordinary least square:

4.6 %


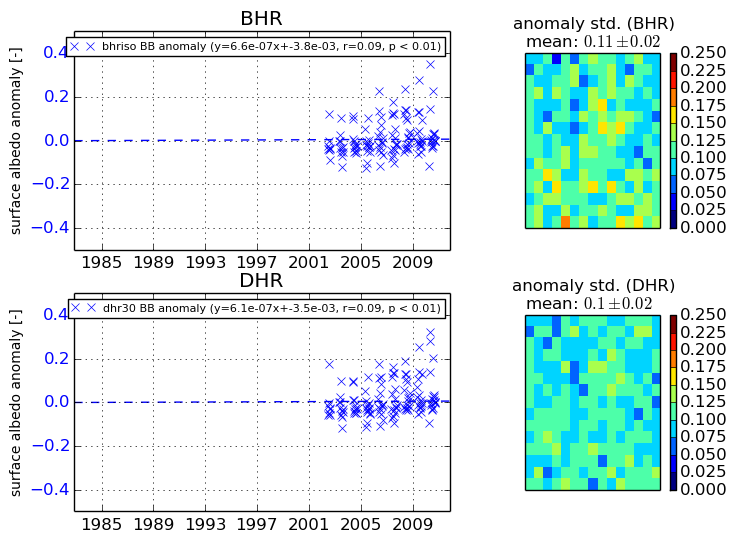
Temporal anomaly analyis

The variance of the temporal anomalies provides an additional measure about the stability of the signal AFTER removal of the mean seasonal cylce.
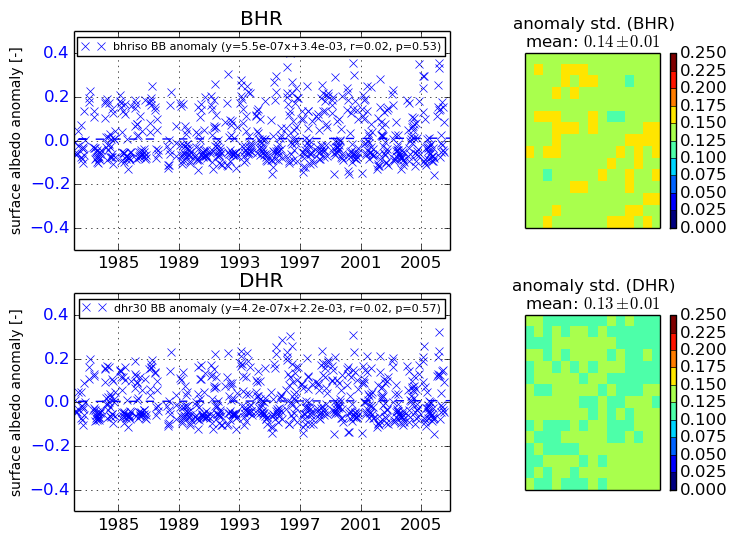
+000 deg


+057/+063 deg