DE-GEB


Location

lon / lat [deg]: 10.9143 / 51.1001

Source network: FLUXNET


Geostationary surface albedo (GSA) data


“+000”


“+057/+063”


Landcover information (based on ESA CCI landcover data)


Landcover fractions @ 2km distance


Landcover fractions @ 20 km distance


Legend


Distance to open water bodies [km]:

4.19

Distance to urban areas [km]:

1.37


Radius: 1 km

Number of landcover classes:

1

Dominant landcover type:

10: cropland, rainfed

Fraction of dominant landcover type [%]:

100.0


Radius: 2 km

Number of landcover classes:

2

Dominant landcover type:

10: cropland, rainfed

Fraction of dominant landcover type [%]:

95.0


Radius: 5 km

Number of landcover classes:

2

Dominant landcover type:

10: cropland, rainfed

Fraction of dominant landcover type [%]:

92.0


Radius: 10 km

Number of landcover classes:

5

Dominant landcover type:

10: cropland, rainfed

Fraction of dominant landcover type [%]:

83.0


Radius: 20 km

Number of landcover classes:

3

Dominant landcover type:

10: cropland, rainfed

Fraction of dominant landcover type [%]:

83.0


Disturbances


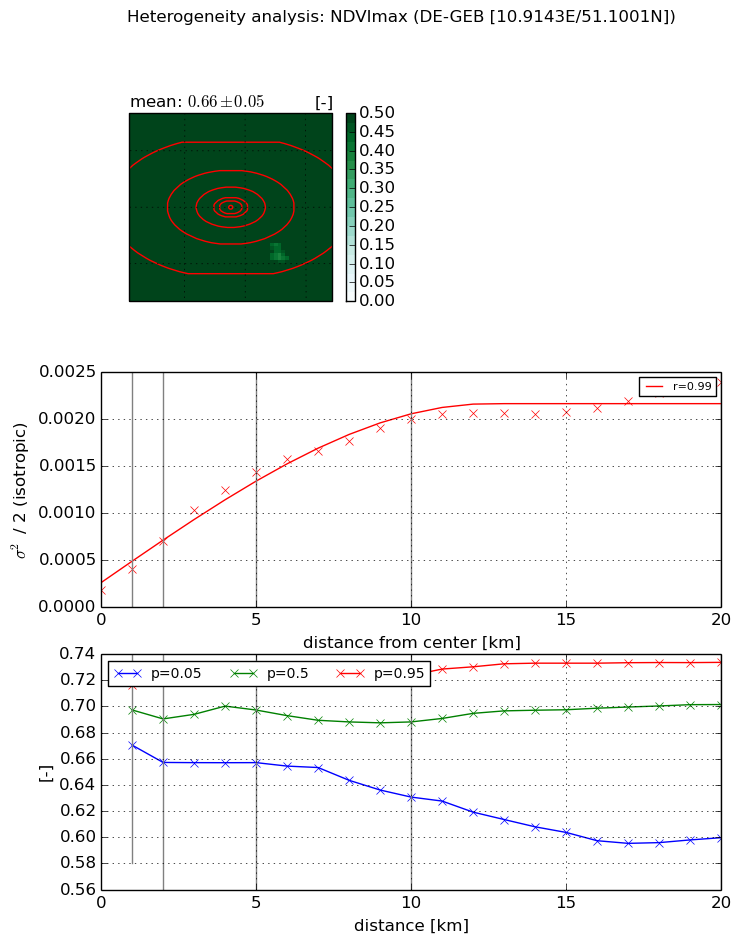
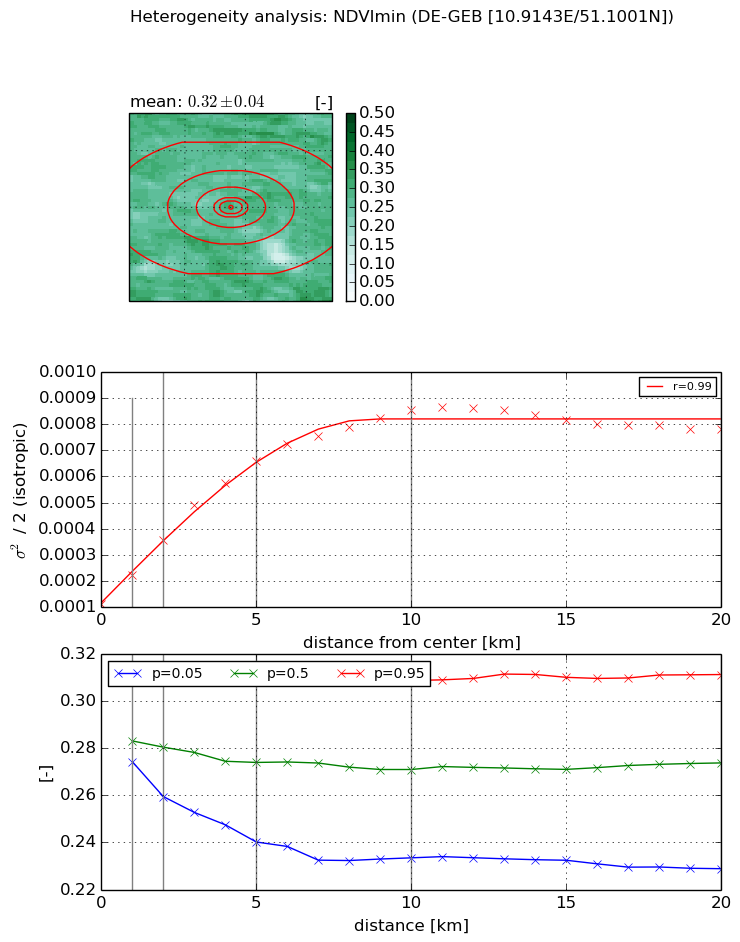
Heterogeneity analysis

The heterogeneity analysis provides information about the spatial and temporal heterogeneity of the site.

Topography


Roman et al. (2009) index


St

2.59503087792

Rcv

0.904414803852

Rse

0.0

Rst

-0.0736413975331

Rsv

0.177999406865


Height range @ 1km [m]

7

Height range @ 2km [m]

22

Height range @ 5km [m]

39

Height range @ 10km [m]

-999

Height range @ 20km [m]

-999


Variance slope @ 1 km

60

Variance slope @ 2 km

57

Variance slope @ 5 km

37

Variance slope @ 10 km

-999

Variance slope @ 20 km

-999


NDVI (max. NDVI composite)


Roman et al. (2009) index


St

15.3701599375

Rcv

-0.145363778029

Rse

0.0

Rst

0.0236881141856

Rsv

0.0261315028959


NDVI range @ 1km [-]

0.05

NDVI range @ 2km [-]

0.07

NDVI range @ 5km [-]

0.06

NDVI range @ 10km [-]

0.09

NDVI range @ 20km [-]

0.13


Variance slope @ 1 km

0.000224982587207

Variance slope @ 2 km

0.000261602851334

Variance slope @ 5 km

0.000259816234967

Variance slope @ 10 km

0.000179737677178

Variance slope @ 20 km

9.37653277649e-05


NDVI (min. NDVI composite)I


Roman et al. (2009) index


St

nan

Rcv

nan

Rse

nan

Rst

nan

Rsv

nan


NDVI range @ 1km [-]

0.04

NDVI range @ 2km [-]

0.05

NDVI range @ 5km [-]

0.07

NDVI range @ 10km [-]

0.08

NDVI range @ 20km [-]

0.08


NDVI slope @ 1 km

0.000110058482155

NDVI slope @ 2 km

0.000122337156091

NDVI slope @ 5 km

0.000112398897644

NDVI slope @ 10 km

7.34895313961e-05

NDVI slope @ 20 km

2.6560698099e-05


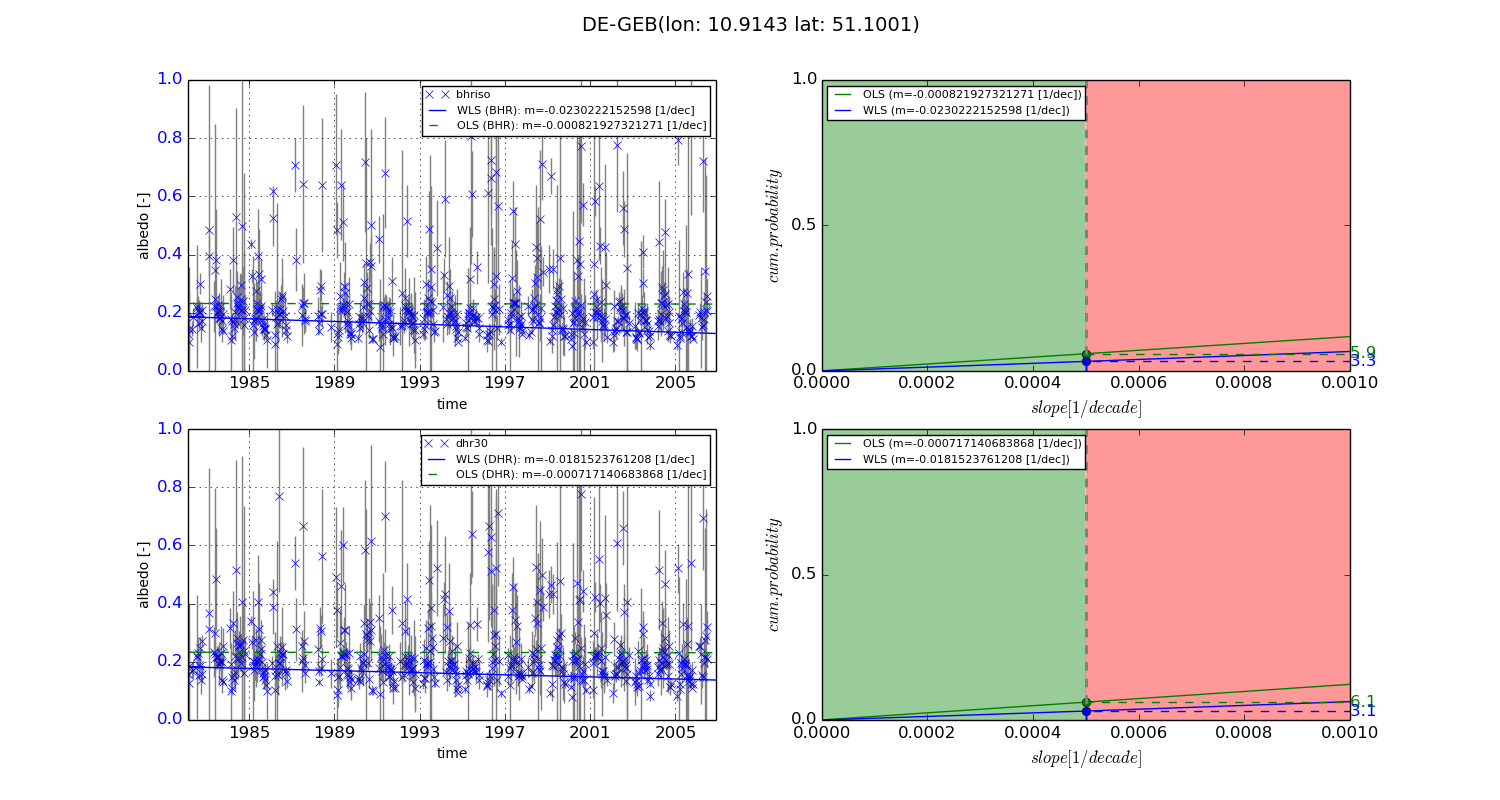
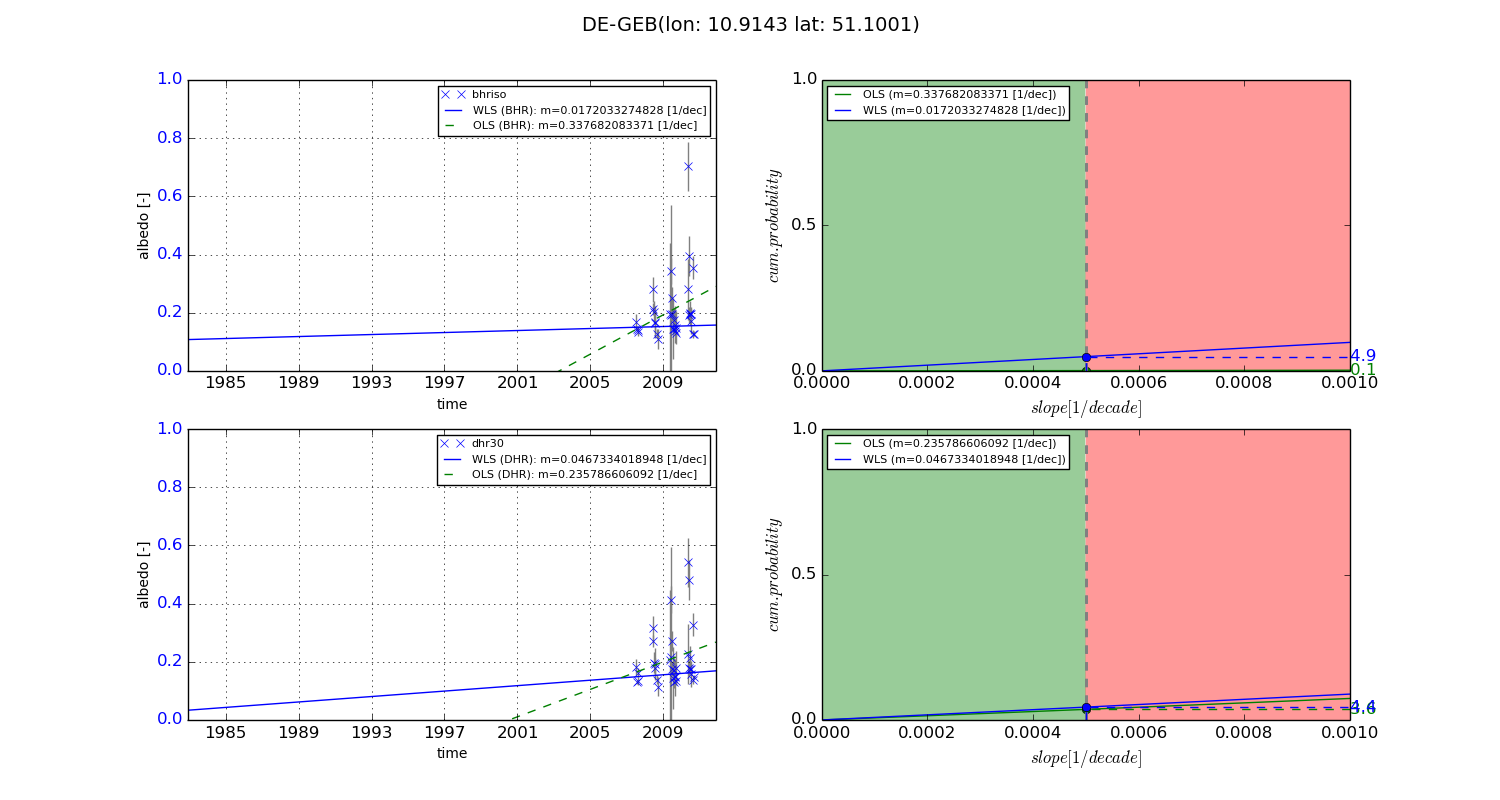
Temporal stability analysis

+000 deg (BHR)


BHR statistics

Temporal stability [1/decade]:


abs

rel


Weighted least square:

-0.0230222152598


Ordinary least square:

-0.000821927321271


Probabilities that GCOS criteria is met:

Weighted least square:

3.3 %

Ordinary least square:

5.9 %


DHR statistics

Temporal stability [1/decade]:


abs

rel


Weighted least square:

-0.0181523761208


Ordinary least square:

-0.000717140683868


Probabilities that GCOS criteria is met:

Weighted least square:

3.1 %

Ordinary least square:

6.1 %


+057/+063 deg (BHR)


BHR statistics

Temporal stability [1/decade]:


abs

rel


Weighted least square:

0.0172033274828


Ordinary least square:

0.337682083371


Probabilities that GCOS criteria is met:

Weighted least square:

4.9 %

Ordinary least square:

0.1 %


DHR statistics

Temporal stability [1/decade]:


abs

rel


Weighted least square:

0.0467334018948


Ordinary least square:

0.235786606092


Probabilities that GCOS criteria is met:

Weighted least square:

4.4 %

Ordinary least square:

3.6 %


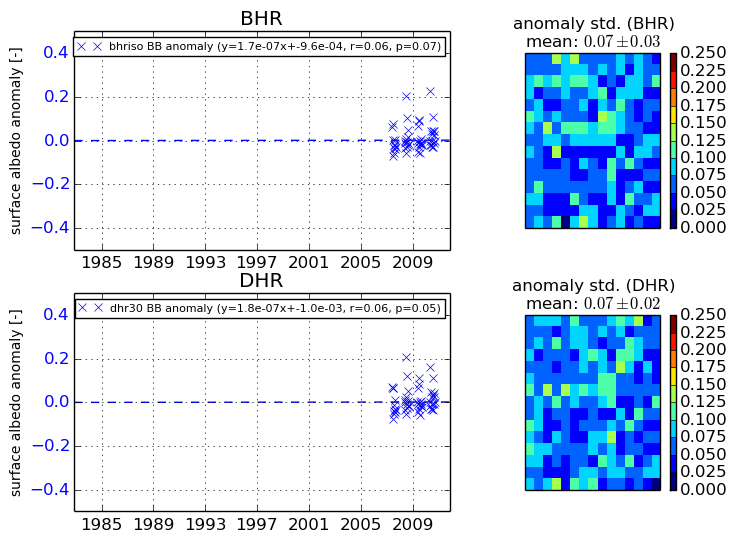
Temporal anomaly analyis

The variance of the temporal anomalies provides an additional measure about the stability of the signal AFTER removal of the mean seasonal cylce.
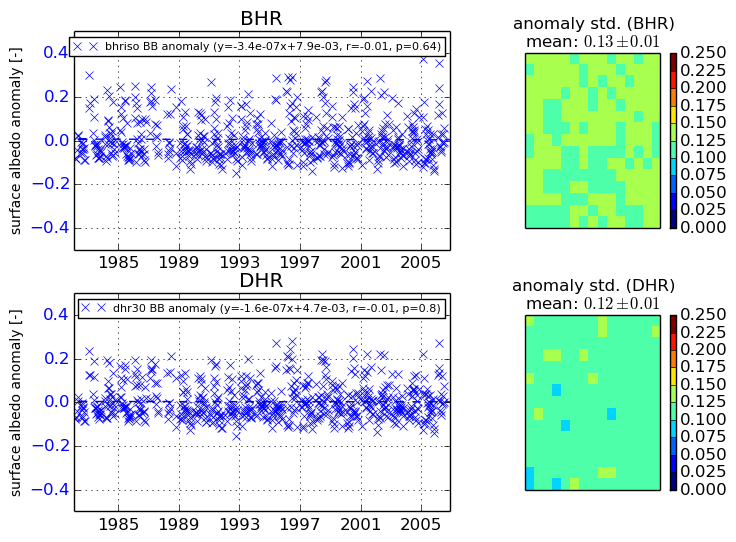
+000 deg


+057/+063 deg