DE-GRI


Location

lon / lat [deg]: 13.5125 / 50.9495

Source network: FLUXNET


Geostationary surface albedo (GSA) data


“+000”


“+057/+063”


Landcover information (based on ESA CCI landcover data)


Landcover fractions @ 2km distance


Landcover fractions @ 20 km distance


Legend


Distance to open water bodies [km]:

5.06

Distance to urban areas [km]:

2.61


Radius: 1 km

Number of landcover classes:

2

Dominant landcover type:

70: Tree cover, needleleaved, evergreen, closed to open (>15%)

Fraction of dominant landcover type [%]:

88.0


Radius: 2 km

Number of landcover classes:

3

Dominant landcover type:

70: Tree cover, needleleaved, evergreen, closed to open (>15%)

Fraction of dominant landcover type [%]:

96.0


Radius: 5 km

Number of landcover classes:

6

Dominant landcover type:

70: Tree cover, needleleaved, evergreen, closed to open (>15%)

Fraction of dominant landcover type [%]:

63.0


Radius: 10 km

Number of landcover classes:

6

Dominant landcover type:

10: cropland, rainfed

Fraction of dominant landcover type [%]:

66.0


Radius: 20 km

Number of landcover classes:

5

Dominant landcover type:

10: cropland, rainfed

Fraction of dominant landcover type [%]:

61.0


Disturbances


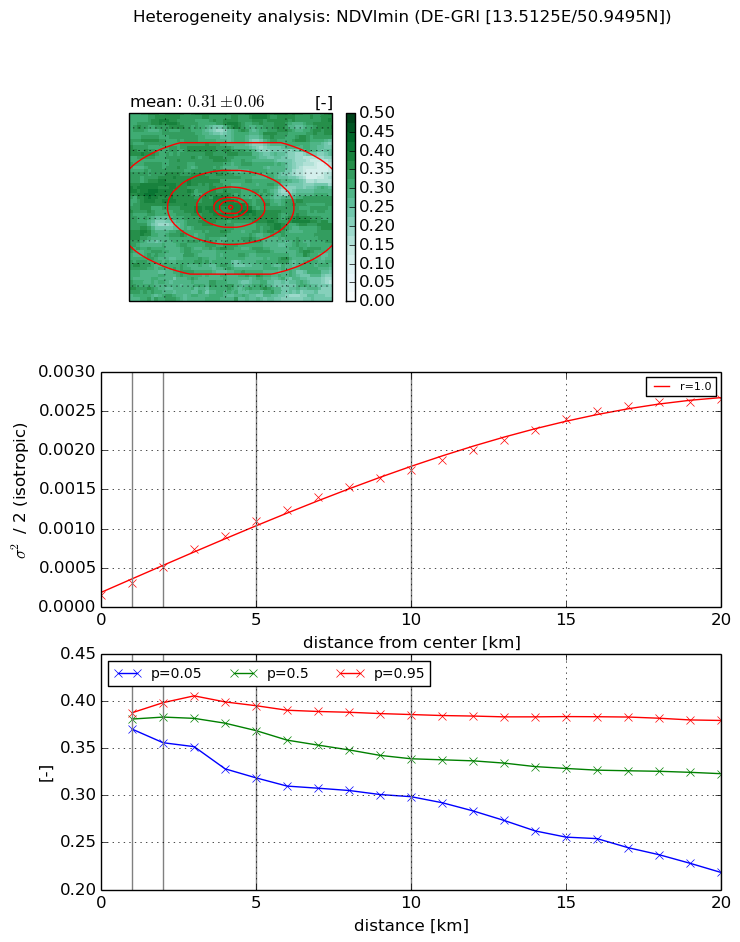
Heterogeneity analysis

The heterogeneity analysis provides information about the spatial and temporal heterogeneity of the site.

Topography


Roman et al. (2009) index


St

2.33262448038

Rcv

0.398264013118

Rse

0.0

Rst

-5.20043122979e-06

Rsv

-0.887835783305


Height range @ 1km [m]

32

Height range @ 2km [m]

59

Height range @ 5km [m]

113

Height range @ 10km [m]

-999

Height range @ 20km [m]

-999


Variance slope @ 1 km

539

Variance slope @ 2 km

408

Variance slope @ 5 km

219

Variance slope @ 10 km

-999

Variance slope @ 20 km

-999


NDVI (max. NDVI composite)


Roman et al. (2009) index


St

9.86626086277e-07

Rcv

0.456805838366

Rse

0.0

Rst

0.271275158756

Rsv

3040664.87131


NDVI range @ 1km [-]

0.01

NDVI range @ 2km [-]

0.02

NDVI range @ 5km [-]

0.06

NDVI range @ 10km [-]

0.07

NDVI range @ 20km [-]

0.17


Variance slope @ 1 km

0.000165970886425

Variance slope @ 2 km

0.000199922384221

Variance slope @ 5 km

0.000226710007718

Variance slope @ 10 km

0.00017431062681

Variance slope @ 20 km

0.000124266934898


NDVI (min. NDVI composite)I


Roman et al. (2009) index


St

4.27561359183

Rcv

0.566376000318

Rse

0.0

Rst

0.0127988404205

Rsv

0.122478836697


NDVI range @ 1km [-]

0.02

NDVI range @ 2km [-]

0.04

NDVI range @ 5km [-]

0.08

NDVI range @ 10km [-]

0.09

NDVI range @ 20km [-]

0.16


NDVI slope @ 1 km

0.000154397229437

NDVI slope @ 2 km

0.000179835478388

NDVI slope @ 5 km

0.000191830797524

NDVI slope @ 10 km

0.000163912902439

NDVI slope @ 20 km

0.000128342940619


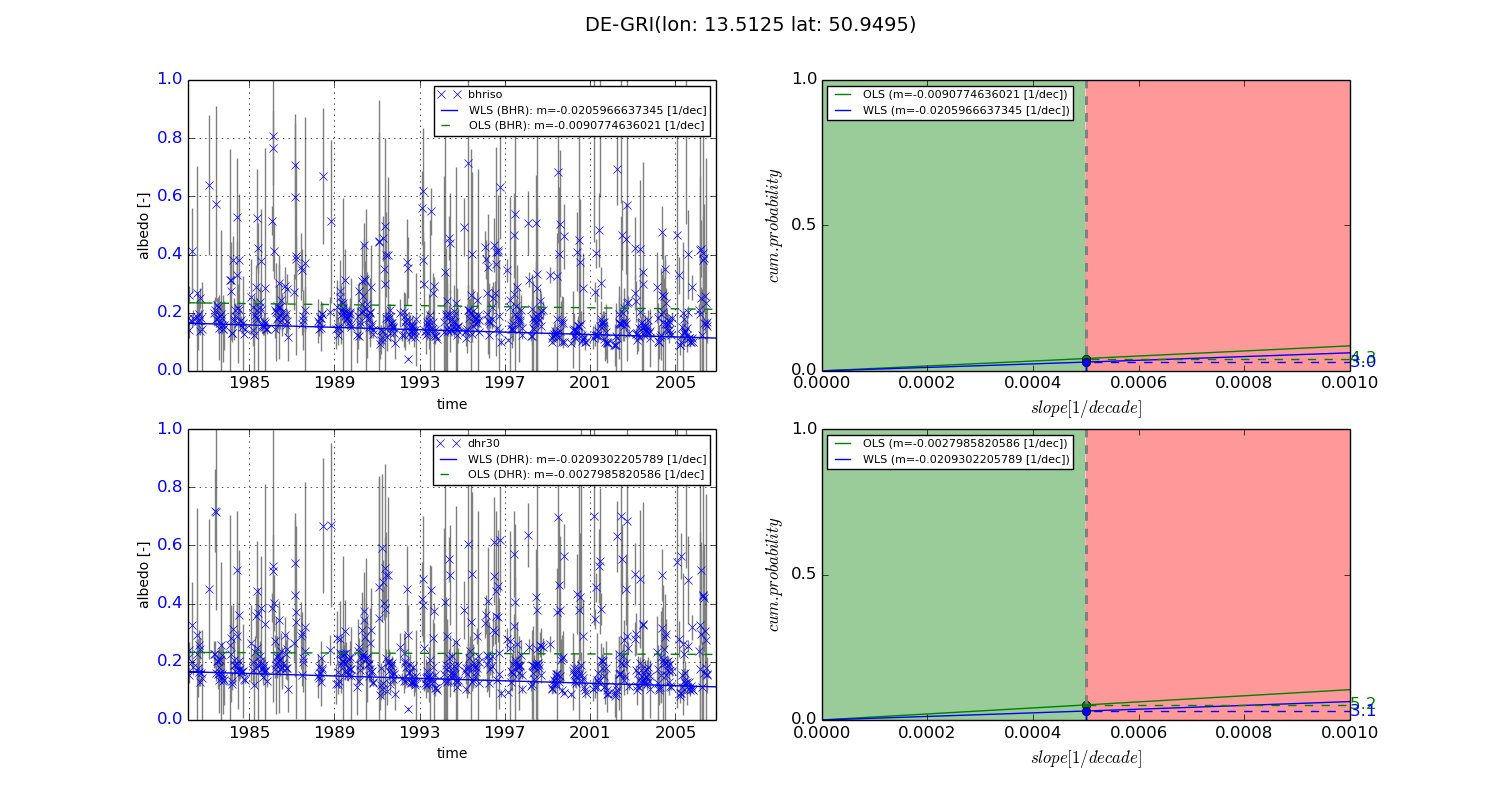
Temporal stability analysis

+000 deg (BHR)


BHR statistics

Temporal stability [1/decade]:


abs

rel


Weighted least square:

-0.0205966637345


Ordinary least square:

-0.0090774636021


Probabilities that GCOS criteria is met:

Weighted least square:

3.0 %

Ordinary least square:

4.3 %


DHR statistics

Temporal stability [1/decade]:


abs

rel


Weighted least square:

-0.0209302205789


Ordinary least square:

-0.0027985820586


Probabilities that GCOS criteria is met:

Weighted least square:

3.1 %

Ordinary least square:

5.2 %


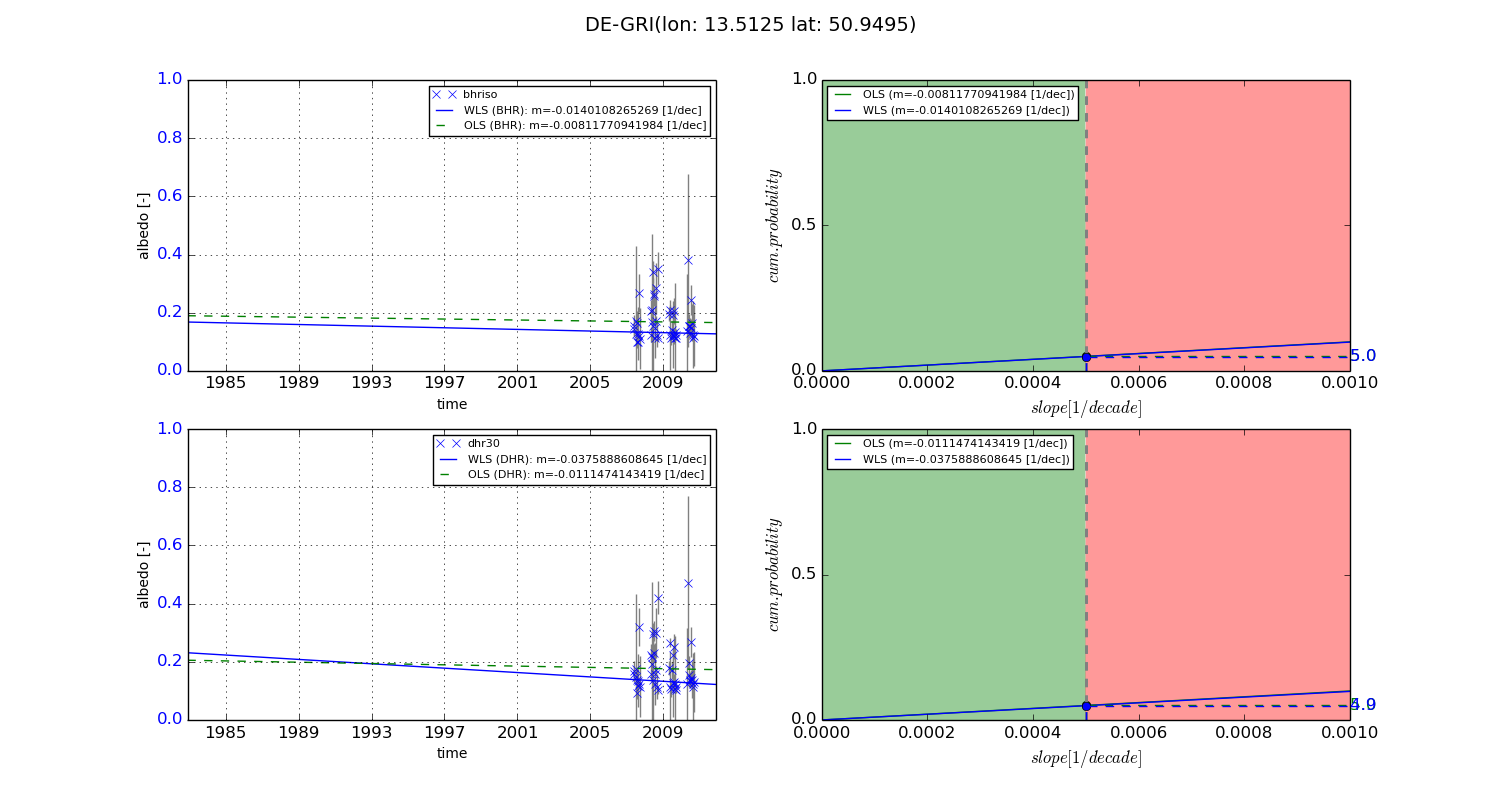
+057/+063 deg (BHR)


BHR statistics

Temporal stability [1/decade]:


abs

rel


Weighted least square:

-0.0140108265269


Ordinary least square:

-0.00811770941984


Probabilities that GCOS criteria is met:

Weighted least square:

5.0 %

Ordinary least square:

5.0 %


DHR statistics

Temporal stability [1/decade]:


abs

rel


Weighted least square:

-0.0375888608645


Ordinary least square:

-0.0111474143419


Probabilities that GCOS criteria is met:

Weighted least square:

4.9 %

Ordinary least square:

5.0 %


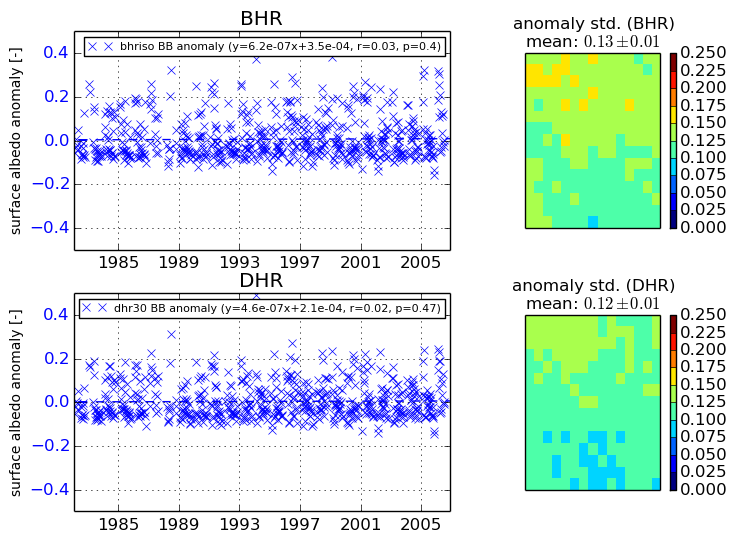
Temporal anomaly analyis

The variance of the temporal anomalies provides an additional measure about the stability of the signal AFTER removal of the mean seasonal cylce.
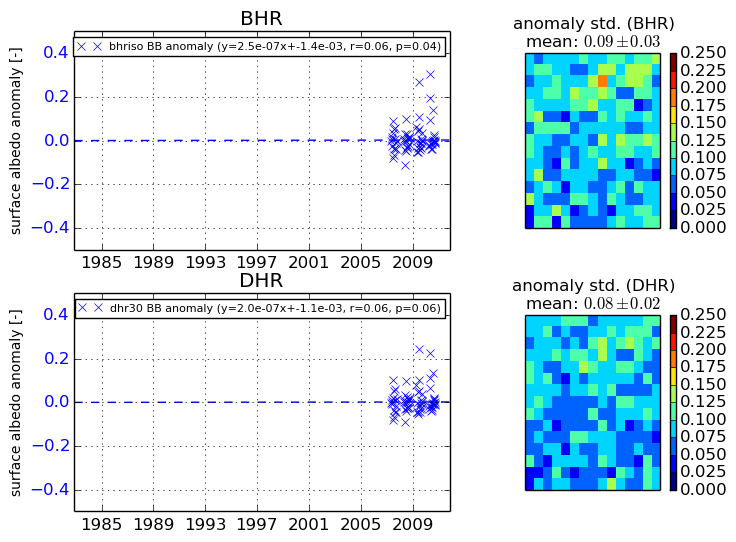
+000 deg


+057/+063 deg