DE-HAR


Location

lon / lat [deg]: 7.601 / 47.9344

Source network: FLUXNET


Geostationary surface albedo (GSA) data


“+000”


“+057/+063”


Landcover information (based on ESA CCI landcover data)


Landcover fractions @ 2km distance


Landcover fractions @ 20 km distance


Legend


Distance to open water bodies [km]:

0.88

Distance to urban areas [km]:

1.27


Radius: 1 km

Number of landcover classes:

6

Dominant landcover type:

10: cropland, rainfed

Fraction of dominant landcover type [%]:

40.0


Radius: 2 km

Number of landcover classes:

10

Dominant landcover type:

10: cropland, rainfed

Fraction of dominant landcover type [%]:

42.0


Radius: 5 km

Number of landcover classes:

9

Dominant landcover type:

10: cropland, rainfed

Fraction of dominant landcover type [%]:

55.0


Radius: 10 km

Number of landcover classes:

8

Dominant landcover type:

10: cropland, rainfed

Fraction of dominant landcover type [%]:

63.0


Radius: 20 km

Number of landcover classes:

9

Dominant landcover type:

10: cropland, rainfed

Fraction of dominant landcover type [%]:

43.0


Disturbances


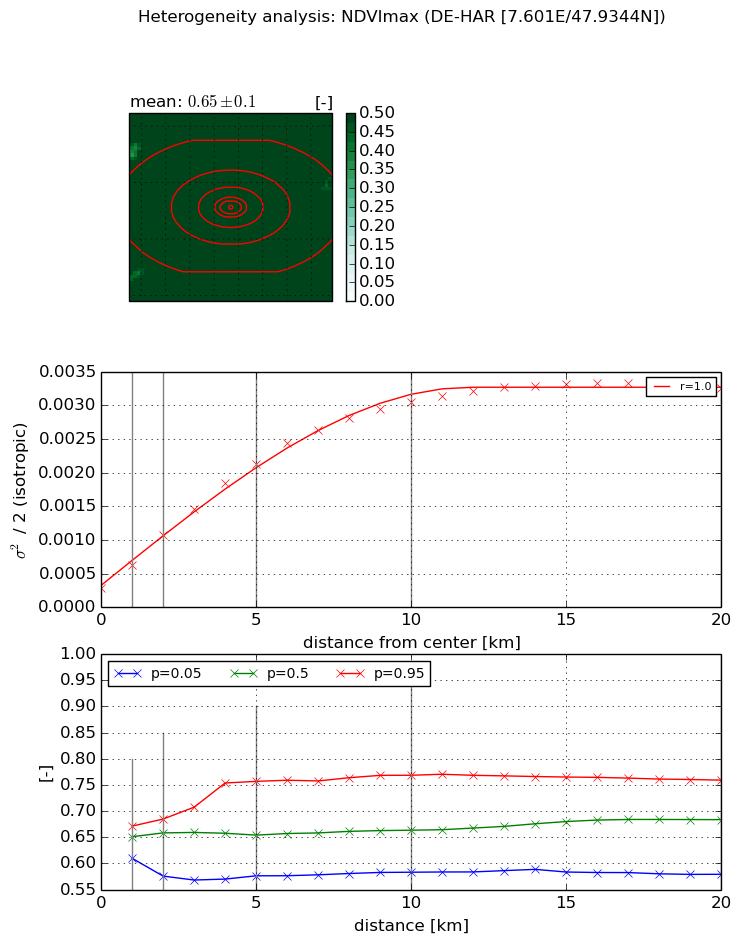
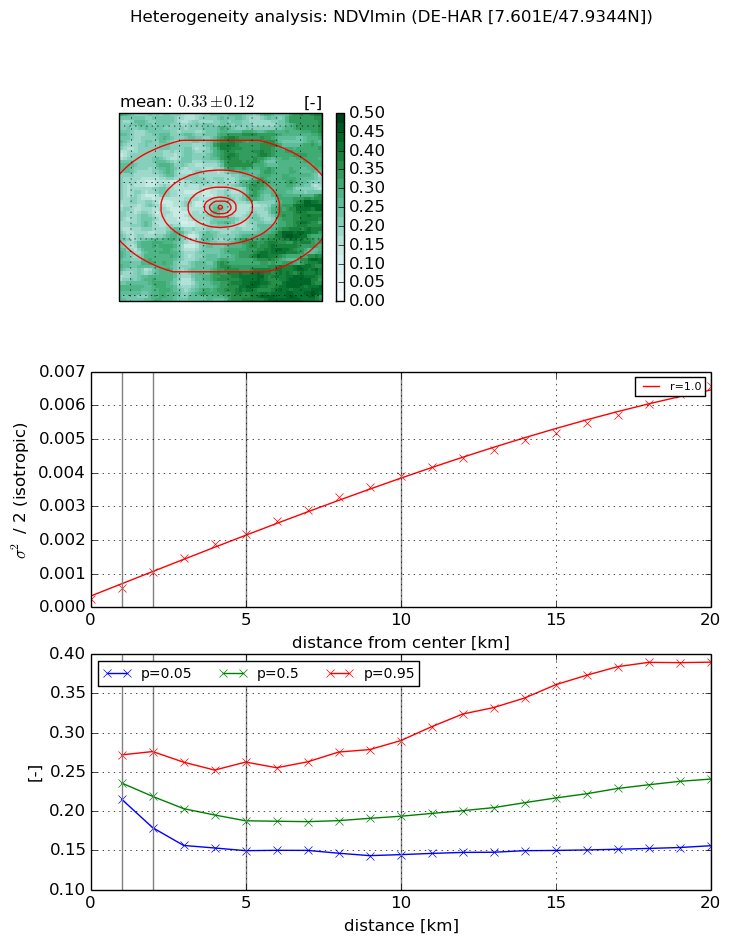
Heterogeneity analysis

The heterogeneity analysis provides information about the spatial and temporal heterogeneity of the site.

Topography


Roman et al. (2009) index


St

2.14446580977

Rcv

0.166543727538

Rse

0.0

Rst

0.232416502021

Rsv

-0.999989563129


Height range @ 1km [m]

9

Height range @ 2km [m]

11

Height range @ 5km [m]

15

Height range @ 10km [m]

-999

Height range @ 20km [m]

-999


Variance slope @ 1 km

6

Variance slope @ 2 km

4

Variance slope @ 5 km

4

Variance slope @ 10 km

-999

Variance slope @ 20 km

-999


NDVI (max. NDVI composite)


Roman et al. (2009) index


St

1.98963323791

Rcv

0.246999945676

Rse

0.0

Rst

-0.260815647564

Rsv

-0.99999998947


NDVI range @ 1km [-]

0.06

NDVI range @ 2km [-]

0.11

NDVI range @ 5km [-]

0.18

NDVI range @ 10km [-]

0.19

NDVI range @ 20km [-]

0.18


Variance slope @ 1 km

0.000339843291811

Variance slope @ 2 km

0.000392426835712

Variance slope @ 5 km

0.000379317993497

Variance slope @ 10 km

0.000285256844356

Variance slope @ 20 km

0.000137677182149


NDVI (min. NDVI composite)I


Roman et al. (2009) index


St

3.70673506115

Rcv

0.124650049755

Rse

0.0

Rst

-0.226042327294

Rsv

0.458645207243


NDVI range @ 1km [-]

0.06

NDVI range @ 2km [-]

0.1

NDVI range @ 5km [-]

0.11

NDVI range @ 10km [-]

0.15

NDVI range @ 20km [-]

0.23


NDVI slope @ 1 km

0.000311818633474

NDVI slope @ 2 km

0.000391996531712

NDVI slope @ 5 km

0.000400247861824

NDVI slope @ 10 km

0.000368771545211

NDVI slope @ 20 km

0.000311518572324


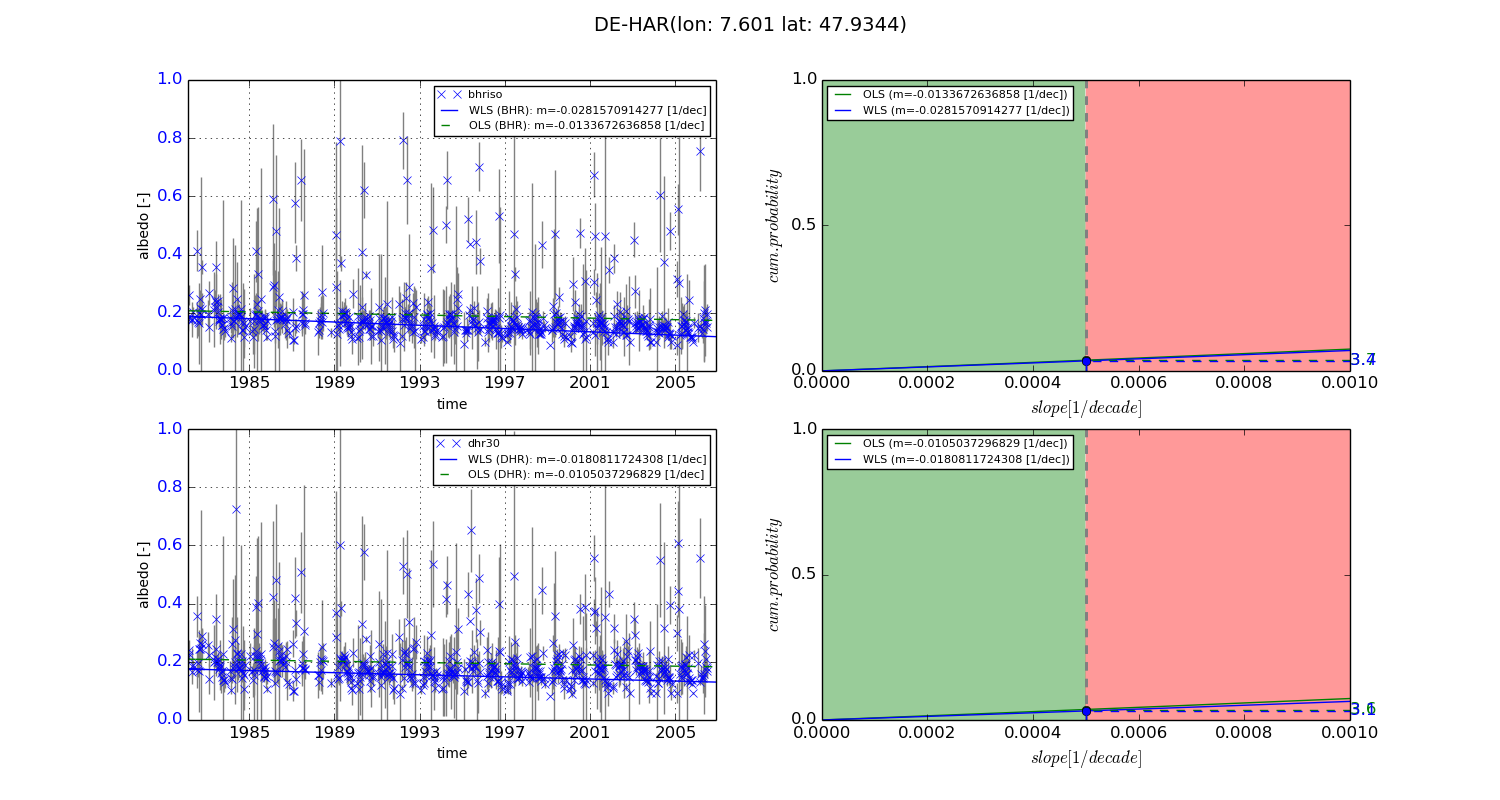
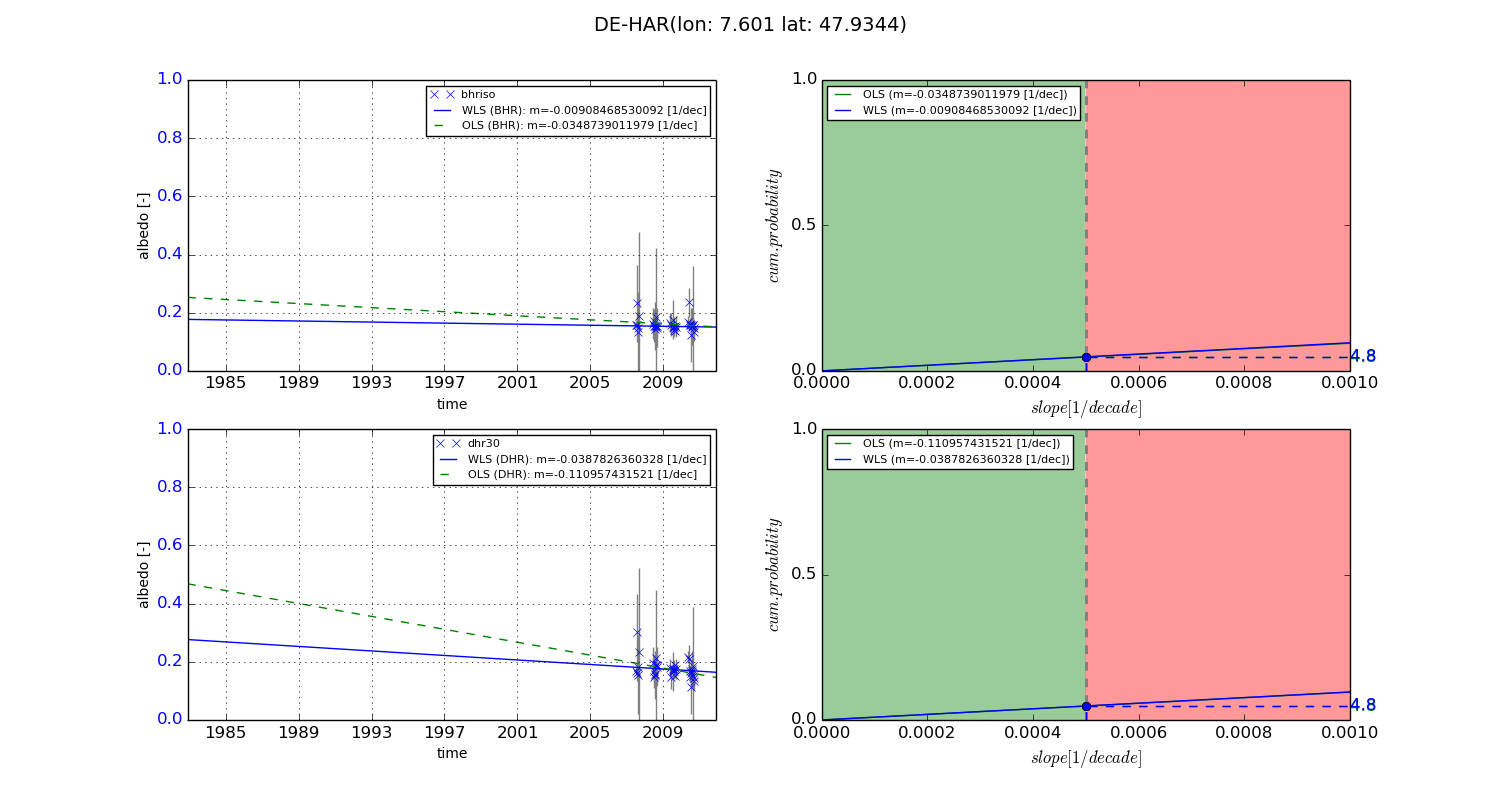
Temporal stability analysis

+000 deg (BHR)


BHR statistics

Temporal stability [1/decade]:


abs

rel


Weighted least square:

-0.0281570914277


Ordinary least square:

-0.0133672636858


Probabilities that GCOS criteria is met:

Weighted least square:

3.4 %

Ordinary least square:

3.7 %


DHR statistics

Temporal stability [1/decade]:


abs

rel


Weighted least square:

-0.0180811724308


Ordinary least square:

-0.0105037296829


Probabilities that GCOS criteria is met:

Weighted least square:

3.1 %

Ordinary least square:

3.6 %


+057/+063 deg (BHR)


BHR statistics

Temporal stability [1/decade]:


abs

rel


Weighted least square:

-0.00908468530092


Ordinary least square:

-0.0348739011979


Probabilities that GCOS criteria is met:

Weighted least square:

4.8 %

Ordinary least square:

4.8 %


DHR statistics

Temporal stability [1/decade]:


abs

rel


Weighted least square:

-0.0387826360328


Ordinary least square:

-0.110957431521


Probabilities that GCOS criteria is met:

Weighted least square:

4.8 %

Ordinary least square:

4.8 %


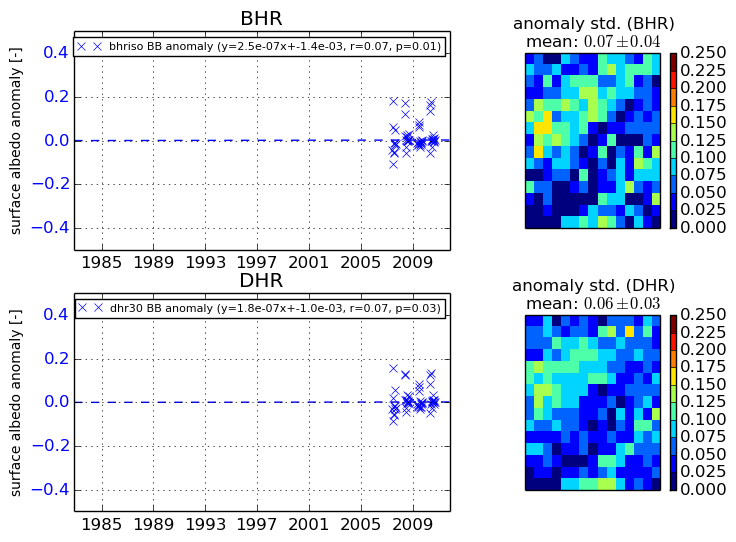
Temporal anomaly analyis

The variance of the temporal anomalies provides an additional measure about the stability of the signal AFTER removal of the mean seasonal cylce.
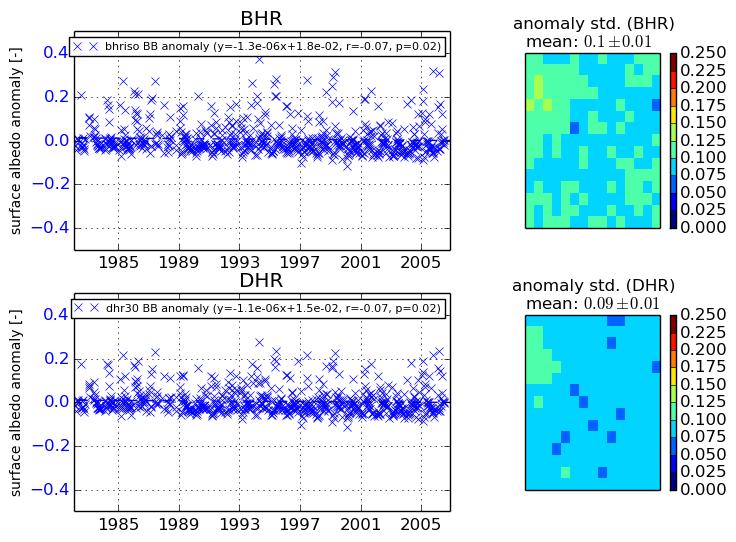
+000 deg


+057/+063 deg