DE-KLI


Location

lon / lat [deg]: 13.5225 / 50.8929

Source network: FLUXNET


Geostationary surface albedo (GSA) data


“+000”


“+057/+063”


Landcover information (based on ESA CCI landcover data)


Landcover fractions @ 2km distance


Landcover fractions @ 20 km distance


Legend


Distance to open water bodies [km]:

1.4

Distance to urban areas [km]:

0.78


Radius: 1 km

Number of landcover classes:

4

Dominant landcover type:

10: cropland, rainfed

Fraction of dominant landcover type [%]:

89.0


Radius: 2 km

Number of landcover classes:

7

Dominant landcover type:

10: cropland, rainfed

Fraction of dominant landcover type [%]:

65.0


Radius: 5 km

Number of landcover classes:

7

Dominant landcover type:

10: cropland, rainfed

Fraction of dominant landcover type [%]:

75.0


Radius: 10 km

Number of landcover classes:

5

Dominant landcover type:

10: cropland, rainfed

Fraction of dominant landcover type [%]:

64.0


Radius: 20 km

Number of landcover classes:

6

Dominant landcover type:

10: cropland, rainfed

Fraction of dominant landcover type [%]:

58.0


Disturbances


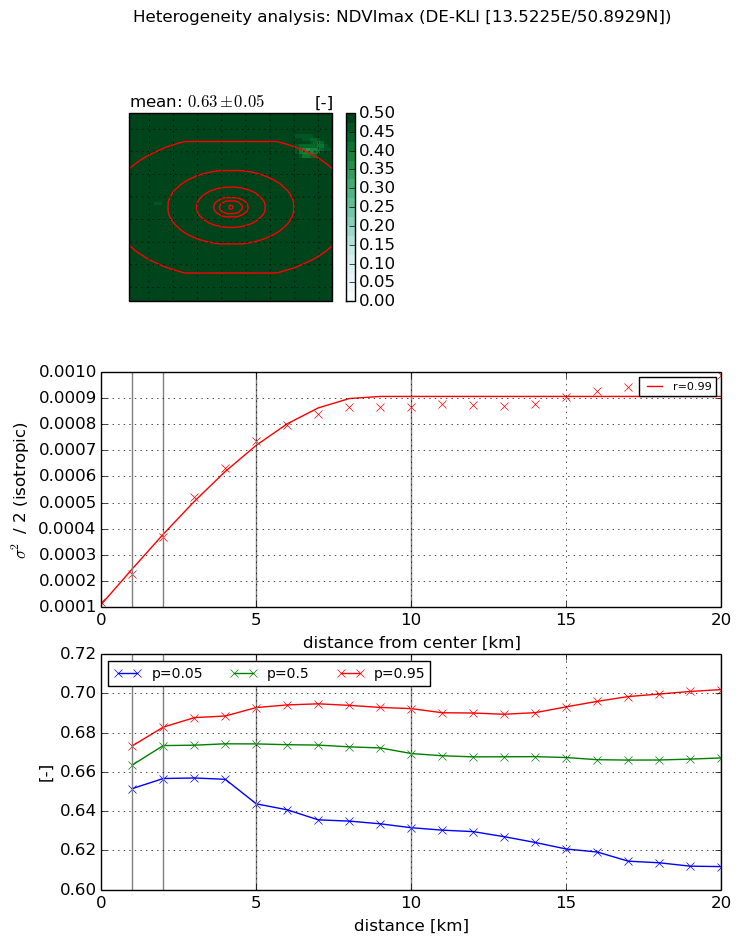
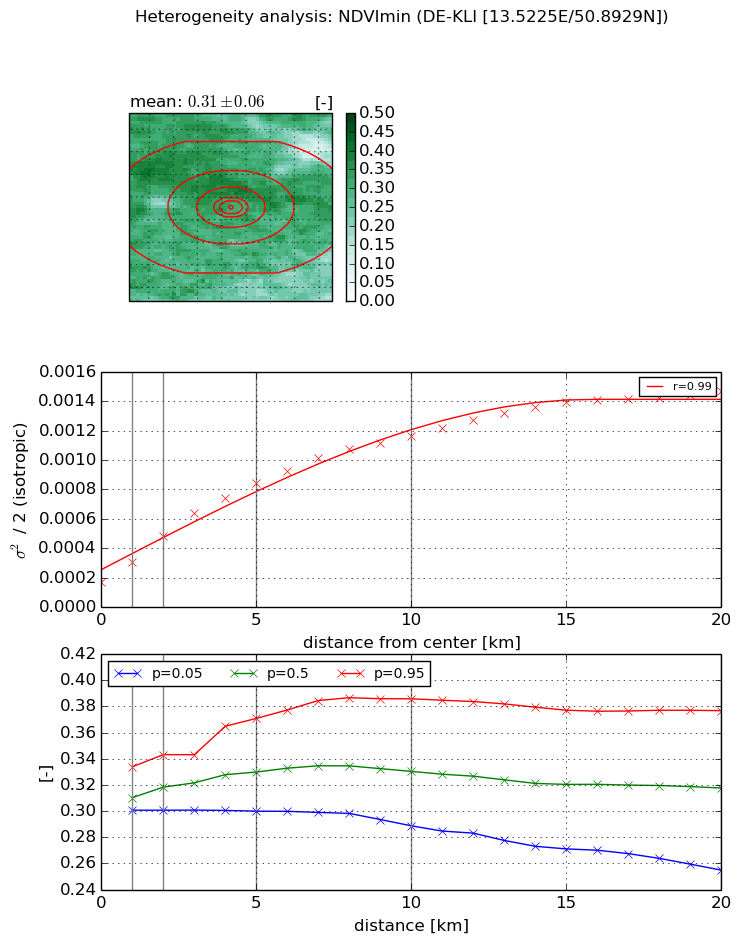
Heterogeneity analysis

The heterogeneity analysis provides information about the spatial and temporal heterogeneity of the site.

Topography


Roman et al. (2009) index


St

0.00226586411837

Rcv

0.350007729004

Rse

0.0

Rst

-1.52217632452e-06

Rsv

1323.64818449


Height range @ 1km [m]

37

Height range @ 2km [m]

89

Height range @ 5km [m]

123

Height range @ 10km [m]

-999

Height range @ 20km [m]

-999


Variance slope @ 1 km

435

Variance slope @ 2 km

367

Variance slope @ 5 km

304

Variance slope @ 10 km

-999

Variance slope @ 20 km

-999


NDVI (max. NDVI composite)


Roman et al. (2009) index


St

1.47165392544

Rcv

0.635544554807

Rse

0.0

Rst

-0.402978396533

Rsv

-0.999999793808


NDVI range @ 1km [-]

0.02

NDVI range @ 2km [-]

0.03

NDVI range @ 5km [-]

0.05

NDVI range @ 10km [-]

0.06

NDVI range @ 20km [-]

0.09


Variance slope @ 1 km

0.00010855305155

Variance slope @ 2 km

0.000125698148415

Variance slope @ 5 km

0.000127494084881

Variance slope @ 10 km

7.80687677748e-05

Variance slope @ 20 km

3.37504162781e-05


NDVI (min. NDVI composite)I


Roman et al. (2009) index


St

1.62375322125

Rcv

0.532296212791

Rse

0.0

Rst

-0.315531582991

Rsv

-0.99974359668


NDVI range @ 1km [-]

0.03

NDVI range @ 2km [-]

0.04

NDVI range @ 5km [-]

0.07

NDVI range @ 10km [-]

0.1

NDVI range @ 20km [-]

0.12


NDVI slope @ 1 km

0.000140891142175

NDVI slope @ 2 km

0.000156478780857

NDVI slope @ 5 km

0.000139056858461

NDVI slope @ 10 km

9.93340536501e-05

NDVI slope @ 20 km

5.98317726937e-05


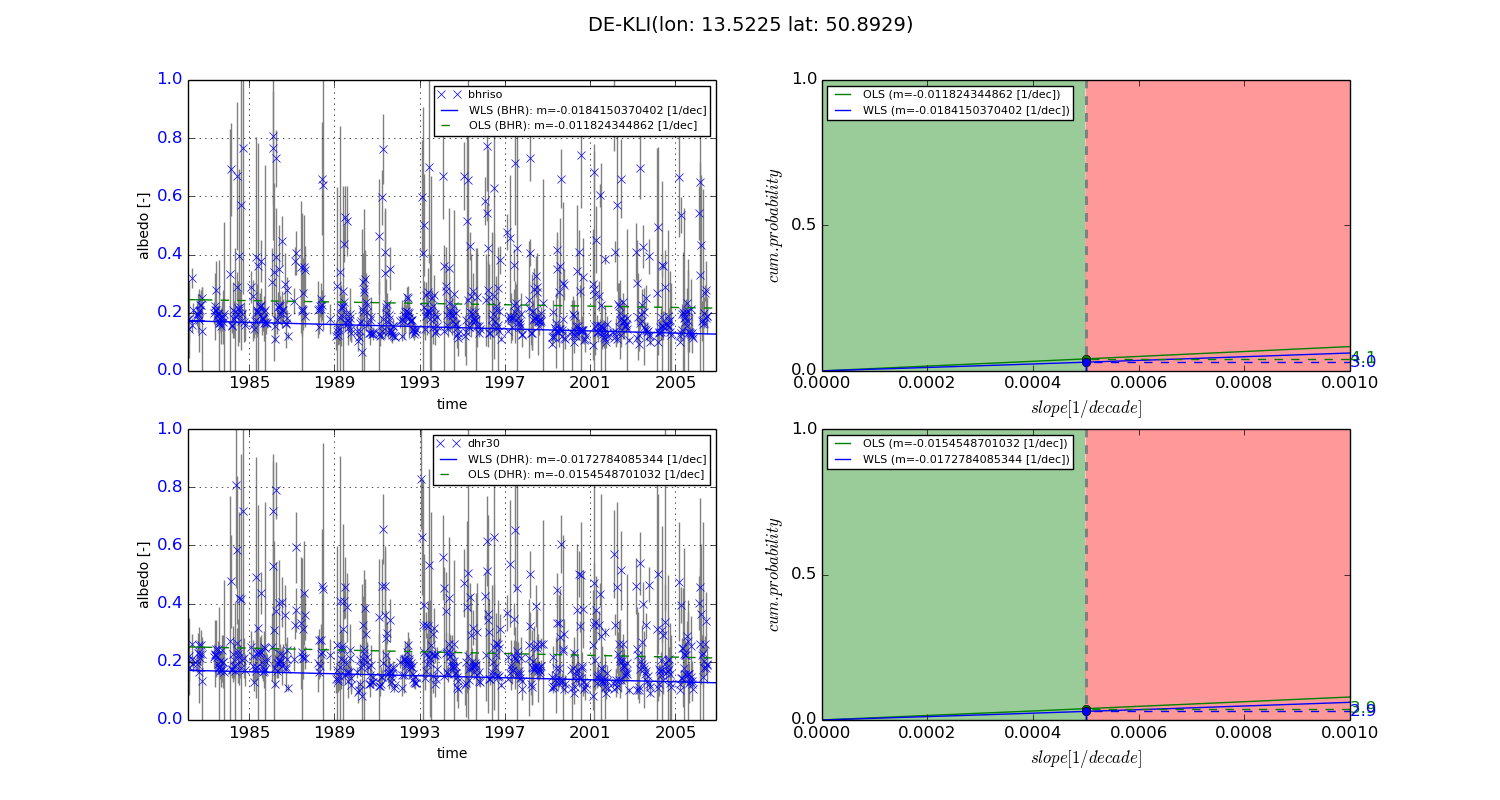
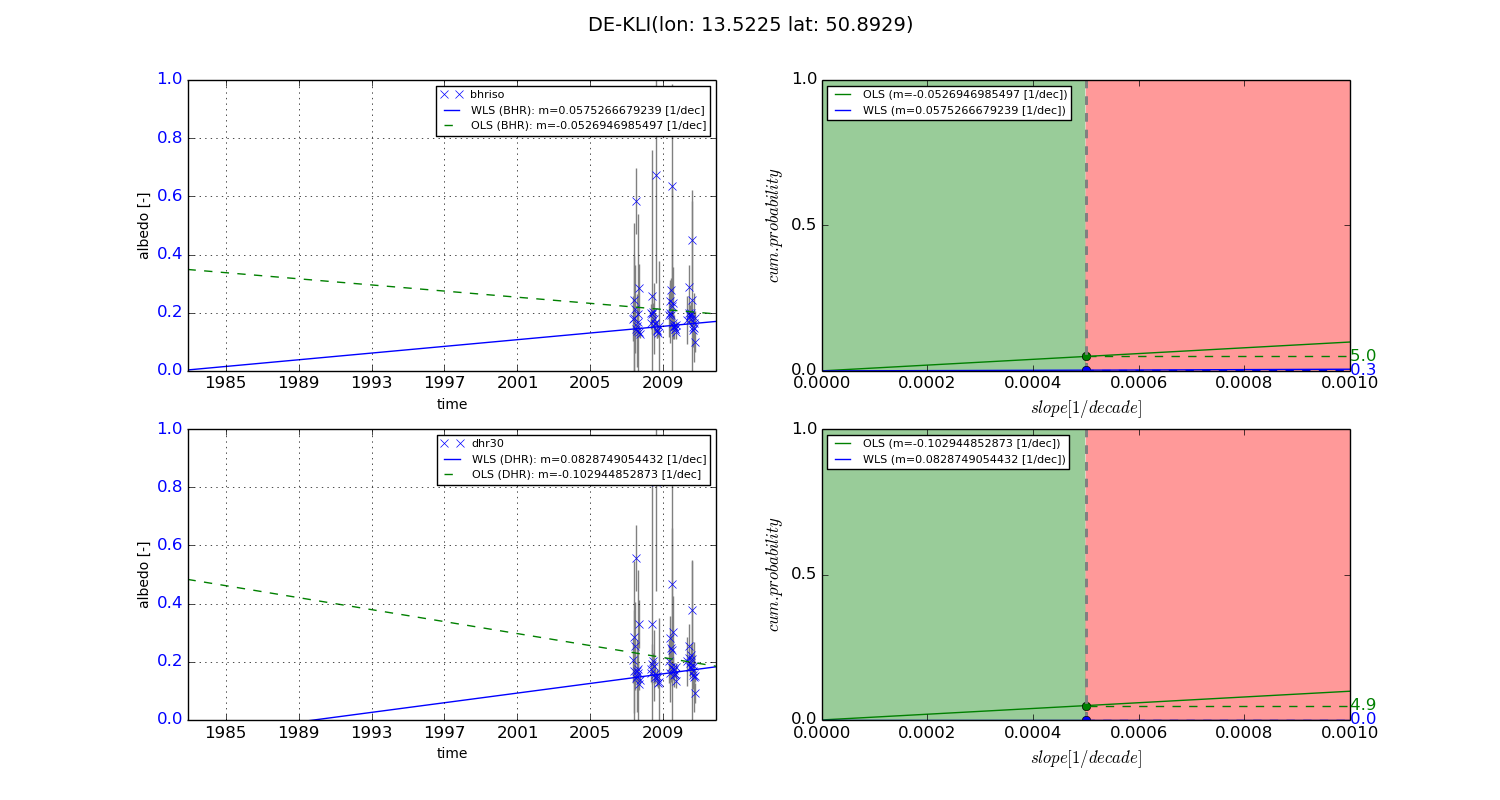
Temporal stability analysis

+000 deg (BHR)


BHR statistics

Temporal stability [1/decade]:


abs

rel


Weighted least square:

-0.0184150370402


Ordinary least square:

-0.011824344862


Probabilities that GCOS criteria is met:

Weighted least square:

3.0 %

Ordinary least square:

4.1 %


DHR statistics

Temporal stability [1/decade]:


abs

rel


Weighted least square:

-0.0172784085344


Ordinary least square:

-0.0154548701032


Probabilities that GCOS criteria is met:

Weighted least square:

2.9 %

Ordinary least square:

3.9 %


+057/+063 deg (BHR)


BHR statistics

Temporal stability [1/decade]:


abs

rel


Weighted least square:

0.0575266679239


Ordinary least square:

-0.0526946985497


Probabilities that GCOS criteria is met:

Weighted least square:

0.3 %

Ordinary least square:

5.0 %


DHR statistics

Temporal stability [1/decade]:


abs

rel


Weighted least square:

0.0828749054432


Ordinary least square:

-0.102944852873


Probabilities that GCOS criteria is met:

Weighted least square:

0.0 %

Ordinary least square:

4.9 %


Temporal anomaly analyis

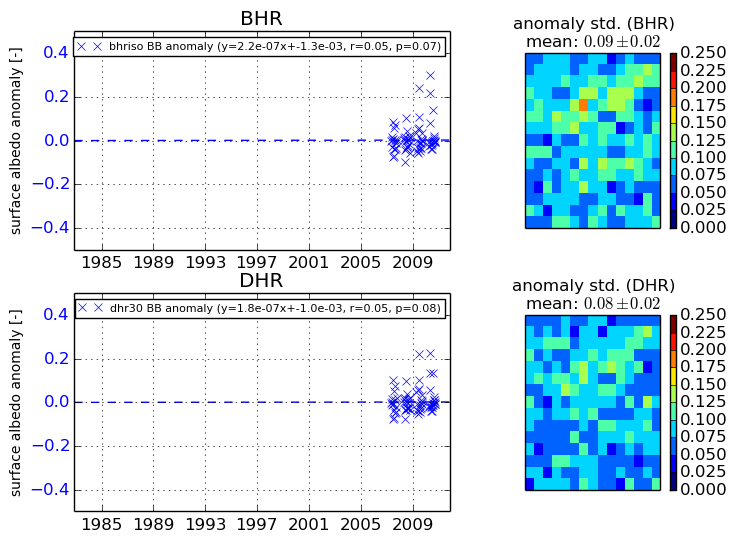
The variance of the temporal anomalies provides an additional measure about the stability of the signal AFTER removal of the mean seasonal cylce.
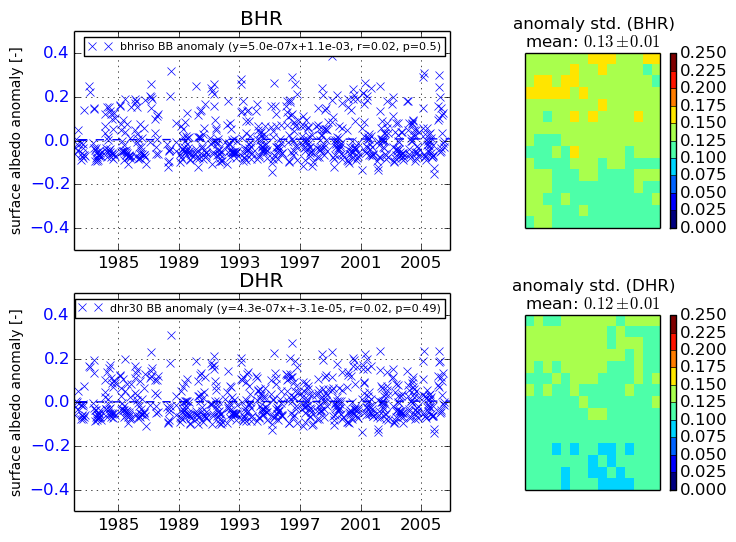
+000 deg


+057/+063 deg