DE-MEH


Location

lon / lat [deg]: 10.6555 / 51.2753

Source network: FLUXNET


Geostationary surface albedo (GSA) data


“+000”


“+057/+063”


Landcover information (based on ESA CCI landcover data)


Landcover fractions @ 2km distance


Landcover fractions @ 20 km distance


Legend


Distance to open water bodies [km]:

16.34

Distance to urban areas [km]:

1.31


Radius: 1 km

Number of landcover classes:

1

Dominant landcover type:

10: cropland, rainfed

Fraction of dominant landcover type [%]:

100.0


Radius: 2 km

Number of landcover classes:

3

Dominant landcover type:

10: cropland, rainfed

Fraction of dominant landcover type [%]:

86.0


Radius: 5 km

Number of landcover classes:

3

Dominant landcover type:

10: cropland, rainfed

Fraction of dominant landcover type [%]:

88.0


Radius: 10 km

Number of landcover classes:

3

Dominant landcover type:

10: cropland, rainfed

Fraction of dominant landcover type [%]:

84.0


Radius: 20 km

Number of landcover classes:

3

Dominant landcover type:

10: cropland, rainfed

Fraction of dominant landcover type [%]:

76.0


Disturbances


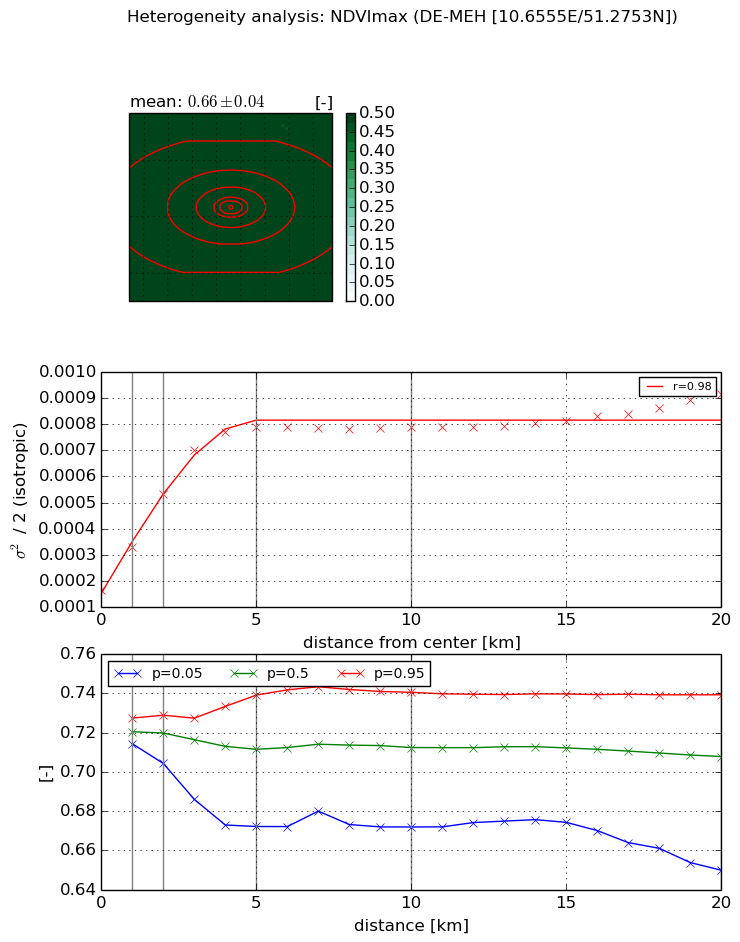
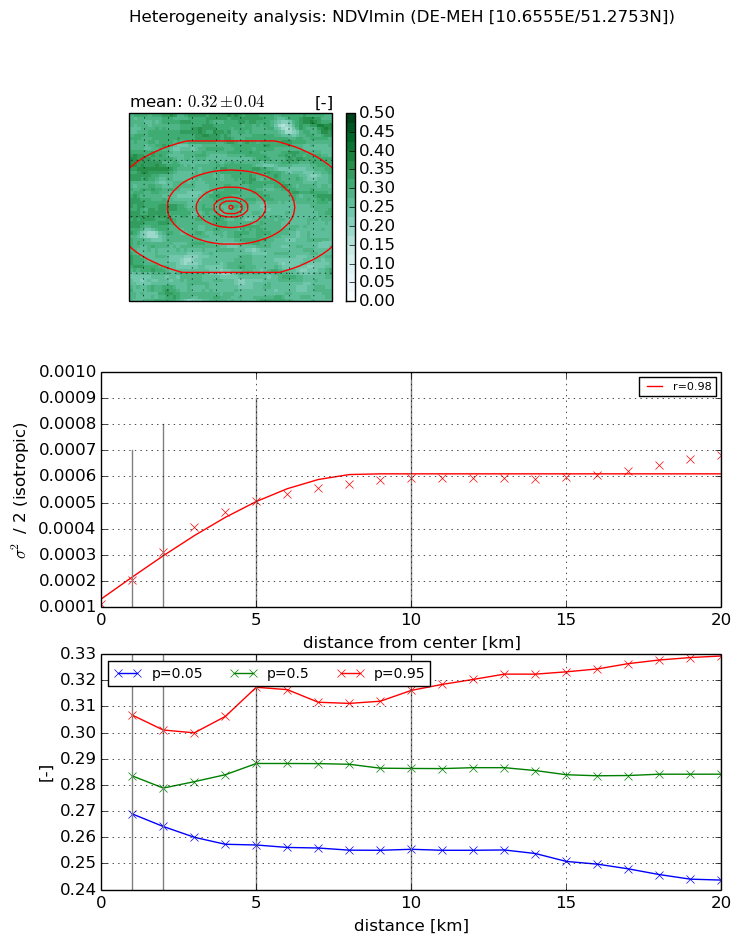
Heterogeneity analysis

The heterogeneity analysis provides information about the spatial and temporal heterogeneity of the site.

Topography


Roman et al. (2009) index


St

3.97975973344

Rcv

0.304422888892

Rse

0.0

Rst

-0.0695284251116

Rsv

-0.379863036846


Height range @ 1km [m]

45

Height range @ 2km [m]

69

Height range @ 5km [m]

105

Height range @ 10km [m]

-999

Height range @ 20km [m]

-999


Variance slope @ 1 km

284

Variance slope @ 2 km

290

Variance slope @ 5 km

300

Variance slope @ 10 km

-999

Variance slope @ 20 km

-999


NDVI (max. NDVI composite)


Roman et al. (2009) index


St

nan

Rcv

nan

Rse

nan

Rst

nan

Rsv

nan


NDVI range @ 1km [-]

0.01

NDVI range @ 2km [-]

0.02

NDVI range @ 5km [-]

0.07

NDVI range @ 10km [-]

0.07

NDVI range @ 20km [-]

0.09


Variance slope @ 1 km

0.000166176319372

Variance slope @ 2 km

0.000183977895271

Variance slope @ 5 km

0.000131830865672

Variance slope @ 10 km

5.33899465055e-05

Variance slope @ 20 km

2.17607239121e-05


NDVI (min. NDVI composite)I


Roman et al. (2009) index


St

nan

Rcv

nan

Rse

nan

Rst

nan

Rsv

nan


NDVI range @ 1km [-]

0.04

NDVI range @ 2km [-]

0.04

NDVI range @ 5km [-]

0.06

NDVI range @ 10km [-]

0.06

NDVI range @ 20km [-]

0.09


NDVI slope @ 1 km

9.09477244994e-05

NDVI slope @ 2 km

9.98708403736e-05

NDVI slope @ 5 km

8.13927837953e-05

NDVI slope @ 10 km

4.62320143776e-05

NDVI slope @ 20 km

2.04471890655e-05


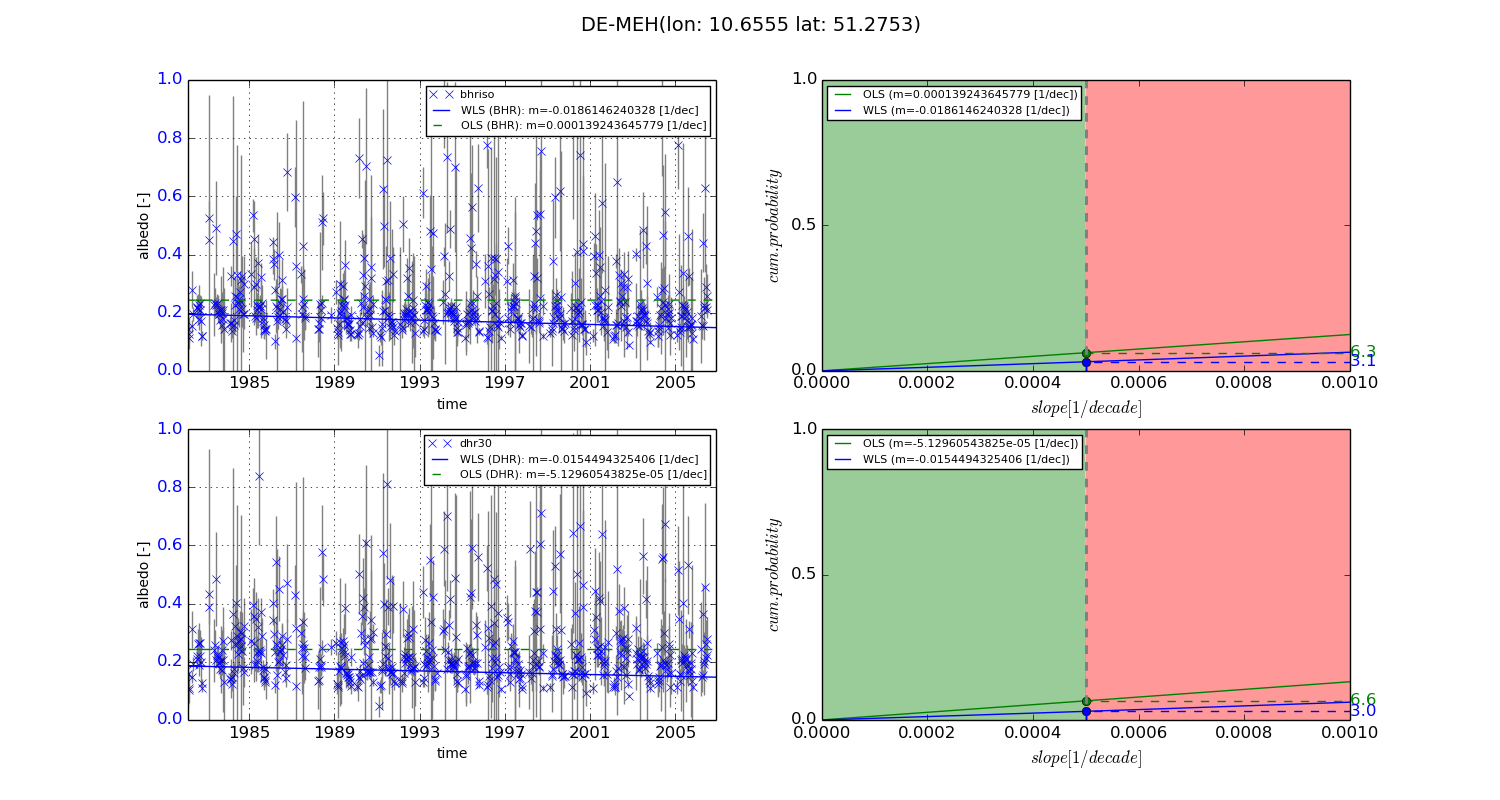
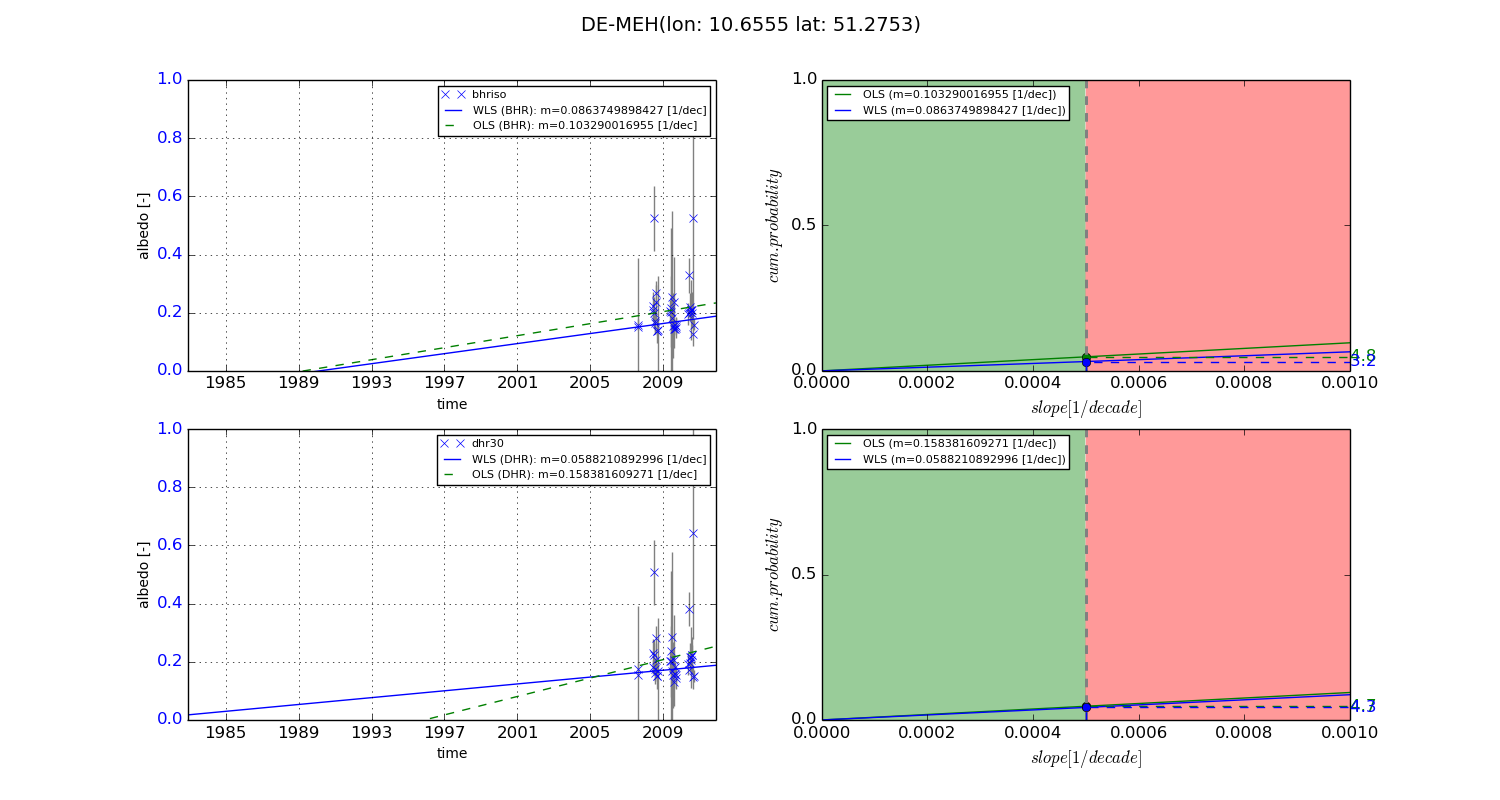
Temporal stability analysis

+000 deg (BHR)


BHR statistics

Temporal stability [1/decade]:


abs

rel


Weighted least square:

-0.0186146240328


Ordinary least square:

0.000139243645779


Probabilities that GCOS criteria is met:

Weighted least square:

3.1 %

Ordinary least square:

6.3 %


DHR statistics

Temporal stability [1/decade]:


abs

rel


Weighted least square:

-0.0154494325406


Ordinary least square:

-5.12960543825e-05


Probabilities that GCOS criteria is met:

Weighted least square:

3.0 %

Ordinary least square:

6.6 %


+057/+063 deg (BHR)


BHR statistics

Temporal stability [1/decade]:


abs

rel


Weighted least square:

0.0863749898427


Ordinary least square:

0.103290016955


Probabilities that GCOS criteria is met:

Weighted least square:

3.2 %

Ordinary least square:

4.8 %


DHR statistics

Temporal stability [1/decade]:


abs

rel


Weighted least square:

0.0588210892996


Ordinary least square:

0.158381609271


Probabilities that GCOS criteria is met:

Weighted least square:

4.3 %

Ordinary least square:

4.7 %


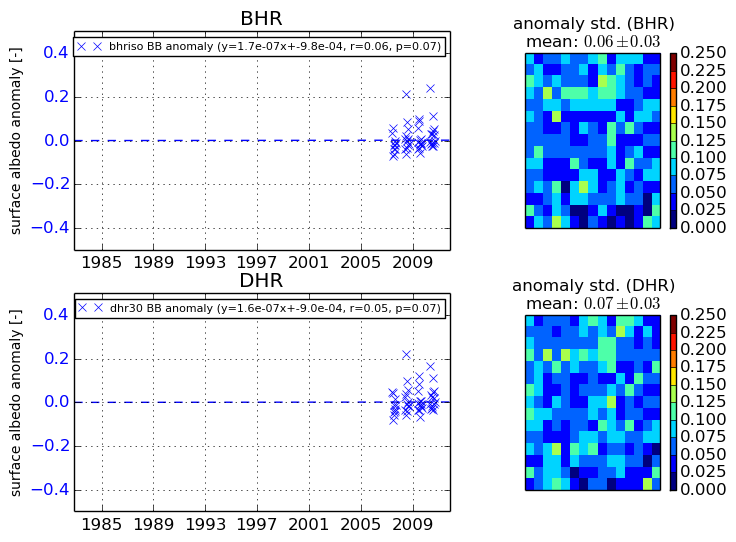
Temporal anomaly analyis

The variance of the temporal anomalies provides an additional measure about the stability of the signal AFTER removal of the mean seasonal cylce.
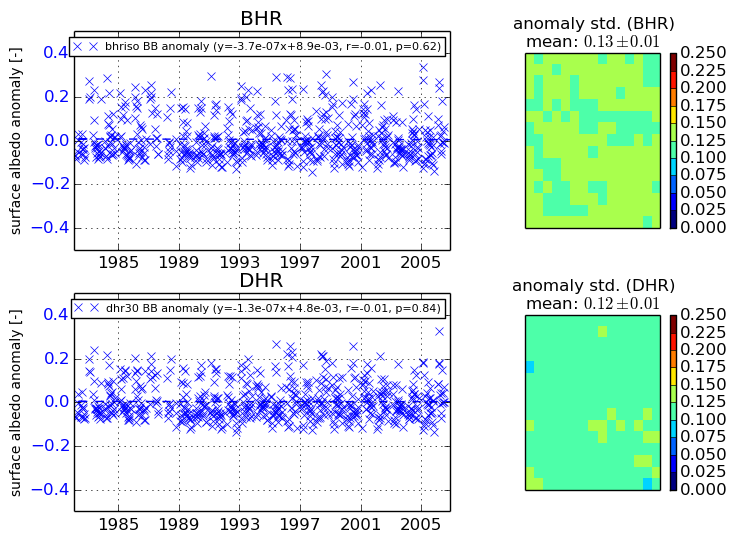
+000 deg


+057/+063 deg