DE-WET


Location

lon / lat [deg]: 11.4575 / 50.4535

Source network: FLUXNET


Geostationary surface albedo (GSA) data


“+000”


“+057/+063”


Landcover information (based on ESA CCI landcover data)


Landcover fractions @ 2km distance


Landcover fractions @ 20 km distance


Legend


Distance to open water bodies [km]:

10.98

Distance to urban areas [km]:

1.41


Radius: 1 km

Number of landcover classes:

1

Dominant landcover type:

70: Tree cover, needleleaved, evergreen, closed to open (>15%)

Fraction of dominant landcover type [%]:

100.0


Radius: 2 km

Number of landcover classes:

3

Dominant landcover type:

70: Tree cover, needleleaved, evergreen, closed to open (>15%)

Fraction of dominant landcover type [%]:

86.0


Radius: 5 km

Number of landcover classes:

4

Dominant landcover type:

70: Tree cover, needleleaved, evergreen, closed to open (>15%)

Fraction of dominant landcover type [%]:

70.0


Radius: 10 km

Number of landcover classes:

5

Dominant landcover type:

70: Tree cover, needleleaved, evergreen, closed to open (>15%)

Fraction of dominant landcover type [%]:

70.0


Radius: 20 km

Number of landcover classes:

7

Dominant landcover type:

70: Tree cover, needleleaved, evergreen, closed to open (>15%)

Fraction of dominant landcover type [%]:

64.0


Disturbances


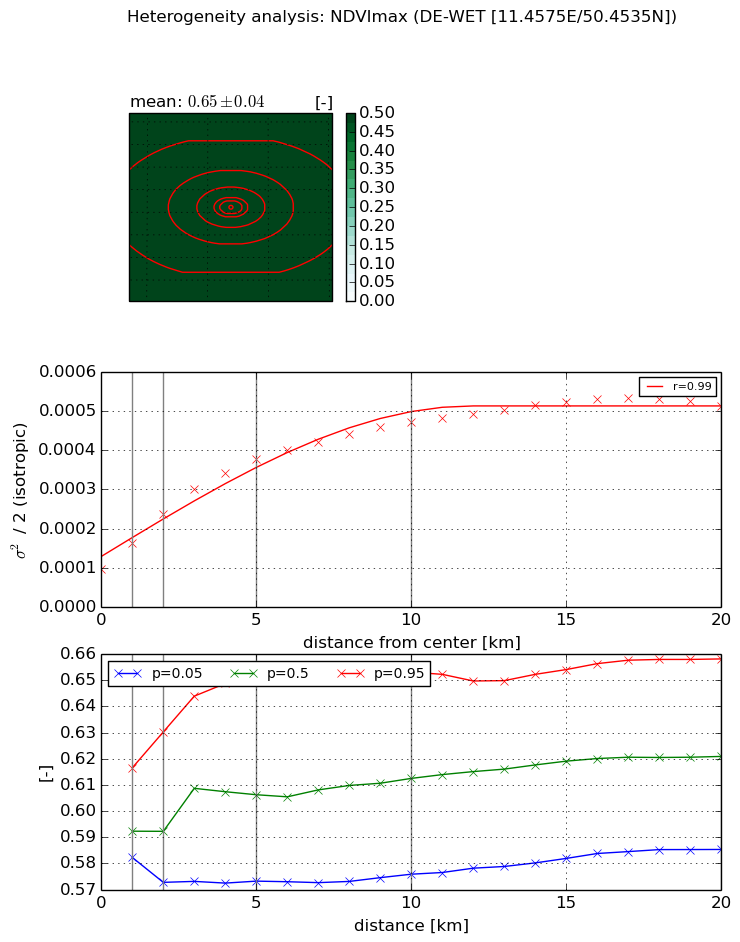
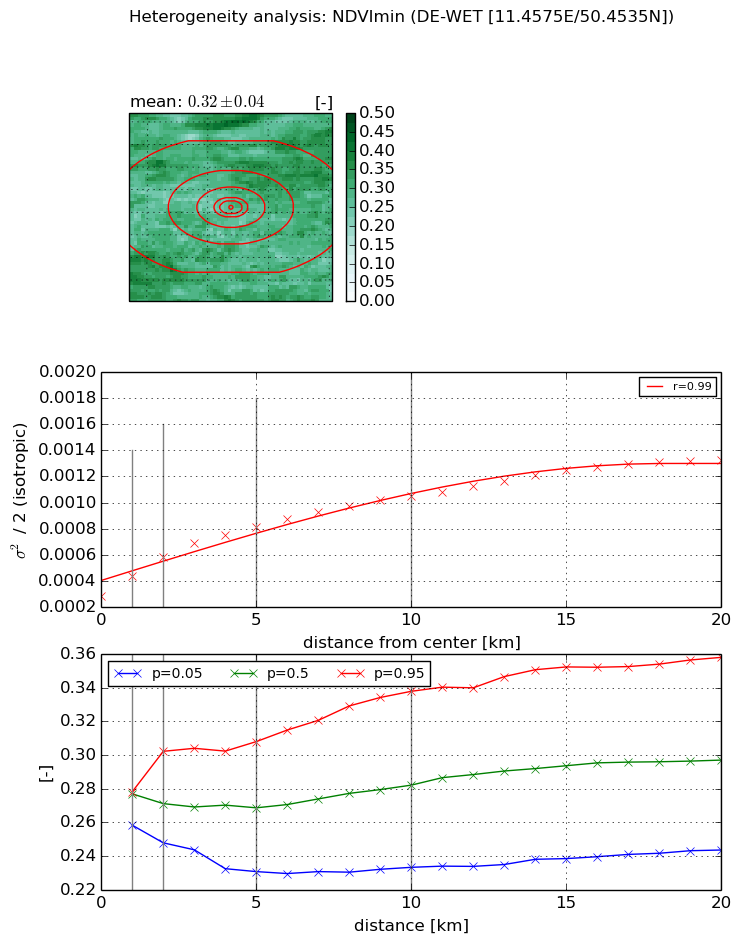
Heterogeneity analysis

The heterogeneity analysis provides information about the spatial and temporal heterogeneity of the site.

Topography


Roman et al. (2009) index


St

3.19248210276

Rcv

0.135799920165

Rse

0.0

Rst

-0.0919863939034

Rsv

0.711921381524


Height range @ 1km [m]

100

Height range @ 2km [m]

130

Height range @ 5km [m]

161

Height range @ 10km [m]

-999

Height range @ 20km [m]

-999


Variance slope @ 1 km

1261

Variance slope @ 2 km

943

Variance slope @ 5 km

690

Variance slope @ 10 km

-999

Variance slope @ 20 km

-999


NDVI (max. NDVI composite)


Roman et al. (2009) index


St

3.31206287654

Rcv

0.0508194628235

Rse

0.0

Rst

-0.0926047633136

Rsv

0.762355679568


NDVI range @ 1km [-]

0.03

NDVI range @ 2km [-]

0.06

NDVI range @ 5km [-]

0.08

NDVI range @ 10km [-]

0.08

NDVI range @ 20km [-]

0.07


Variance slope @ 1 km

6.58607970657e-05

Variance slope @ 2 km

7.01289220342e-05

Variance slope @ 5 km

5.71615267803e-05

Variance slope @ 10 km

3.62641142294e-05

Variance slope @ 20 km

1.82957609722e-05


NDVI (min. NDVI composite)I


Roman et al. (2009) index


St

2.69128705036

Rcv

0.19683757516

Rse

0.0

Rst

-0.14252275376

Rsv

0.775347966355


NDVI range @ 1km [-]

0.02

NDVI range @ 2km [-]

0.05

NDVI range @ 5km [-]

0.08

NDVI range @ 10km [-]

0.1

NDVI range @ 20km [-]

0.11


NDVI slope @ 1 km

0.000147972352349

NDVI slope @ 2 km

0.000145914343301

NDVI slope @ 5 km

0.000105287734417

NDVI slope @ 10 km

7.19511628283e-05

NDVI slope @ 20 km

4.68847795939e-05


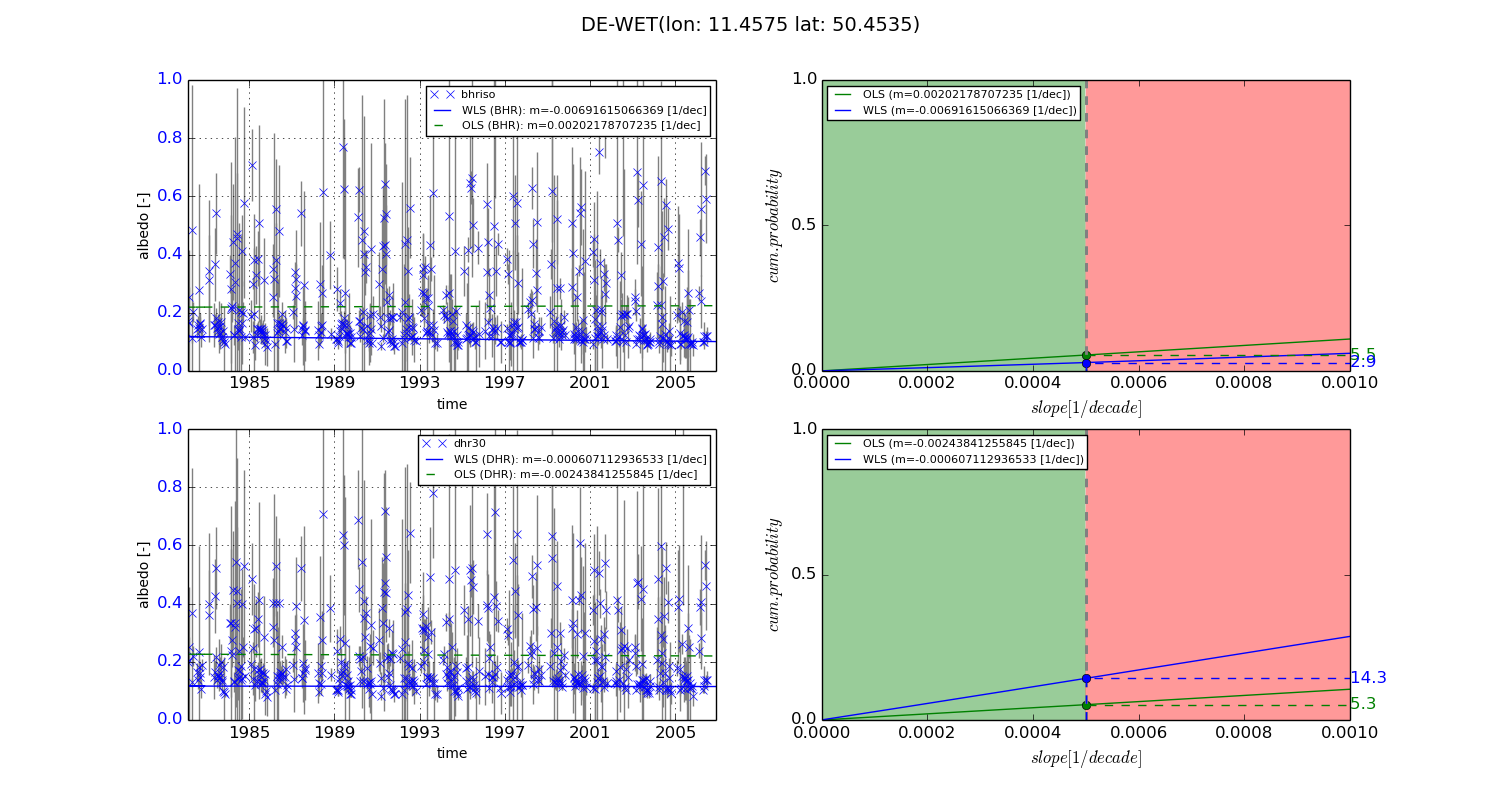
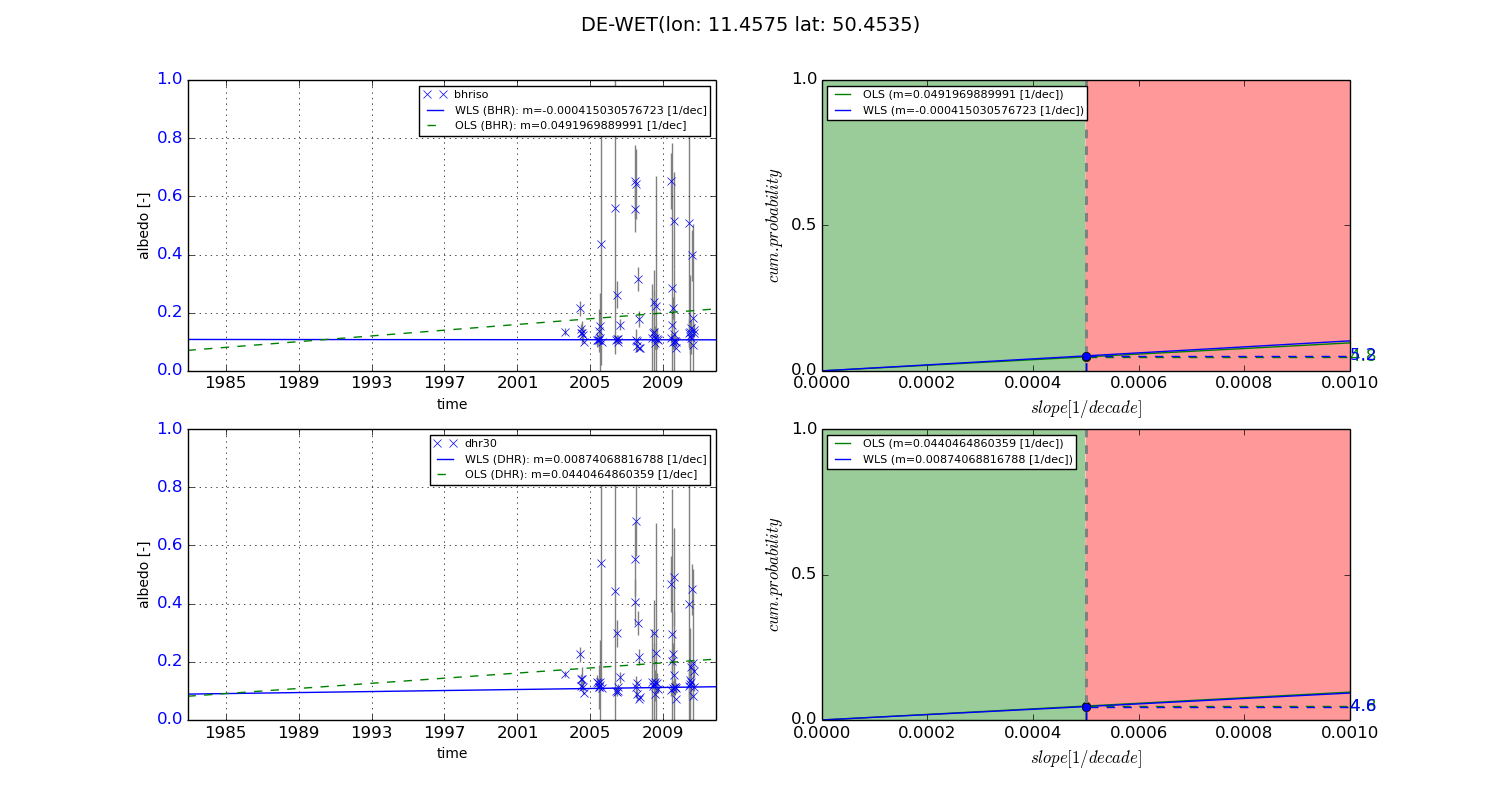
Temporal stability analysis

+000 deg (BHR)


BHR statistics

Temporal stability [1/decade]:


abs

rel


Weighted least square:

-0.00691615066369


Ordinary least square:

0.00202178707235


Probabilities that GCOS criteria is met:

Weighted least square:

2.9 %

Ordinary least square:

5.5 %


DHR statistics

Temporal stability [1/decade]:


abs

rel


Weighted least square:

-0.000607112936533


Ordinary least square:

-0.00243841255845


Probabilities that GCOS criteria is met:

Weighted least square:

14.3 %

Ordinary least square:

5.3 %


+057/+063 deg (BHR)


BHR statistics

Temporal stability [1/decade]:


abs

rel


Weighted least square:

-0.000415030576723


Ordinary least square:

0.0491969889991


Probabilities that GCOS criteria is met:

Weighted least square:

5.2 %

Ordinary least square:

4.8 %


DHR statistics

Temporal stability [1/decade]:


abs

rel


Weighted least square:

0.00874068816788


Ordinary least square:

0.0440464860359


Probabilities that GCOS criteria is met:

Weighted least square:

4.6 %

Ordinary least square:

4.8 %


Temporal anomaly analyis

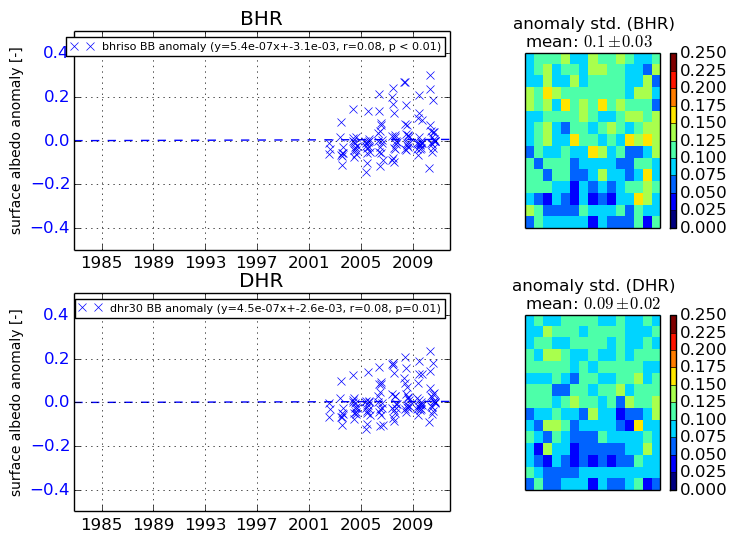
The variance of the temporal anomalies provides an additional measure about the stability of the signal AFTER removal of the mean seasonal cylce.
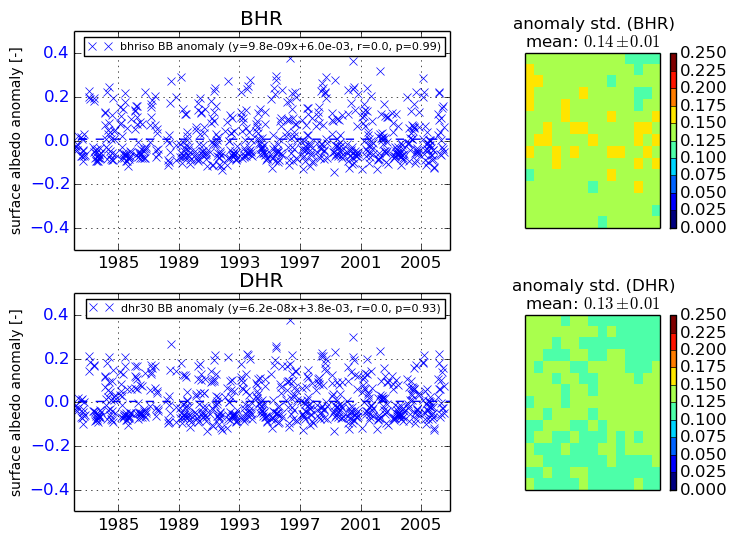
+000 deg


+057/+063 deg


By continuing to use this website, you are giving consent to analytic cookies being used. For more information on how EUMETSAT uses data and how you can disable this, please view this web page: Analytics Cookie Policy