DHARWAR


Location

lon / lat [deg]: 74.9886 / 15.4286

Source network: AERONET


Geostationary surface albedo (GSA) data


“+000”


“+057/+063”


Landcover information (based on ESA CCI landcover data)


Landcover fractions @ 2km distance


Landcover fractions @ 20 km distance


Legend


Distance to open water bodies [km]:

3.14

Distance to urban areas [km]:

2.12


Radius: 1 km

Number of landcover classes:

2

Dominant landcover type:

10: cropland, rainfed

Fraction of dominant landcover type [%]:

97.0


Radius: 2 km

Number of landcover classes:

2

Dominant landcover type:

10: cropland, rainfed

Fraction of dominant landcover type [%]:

87.0


Radius: 5 km

Number of landcover classes:

6

Dominant landcover type:

10: cropland, rainfed

Fraction of dominant landcover type [%]:

60.0


Radius: 10 km

Number of landcover classes:

6

Dominant landcover type:

10: cropland, rainfed

Fraction of dominant landcover type [%]:

53.0


Radius: 20 km

Number of landcover classes:

7

Dominant landcover type:

10: cropland, rainfed

Fraction of dominant landcover type [%]:

44.0


Disturbances


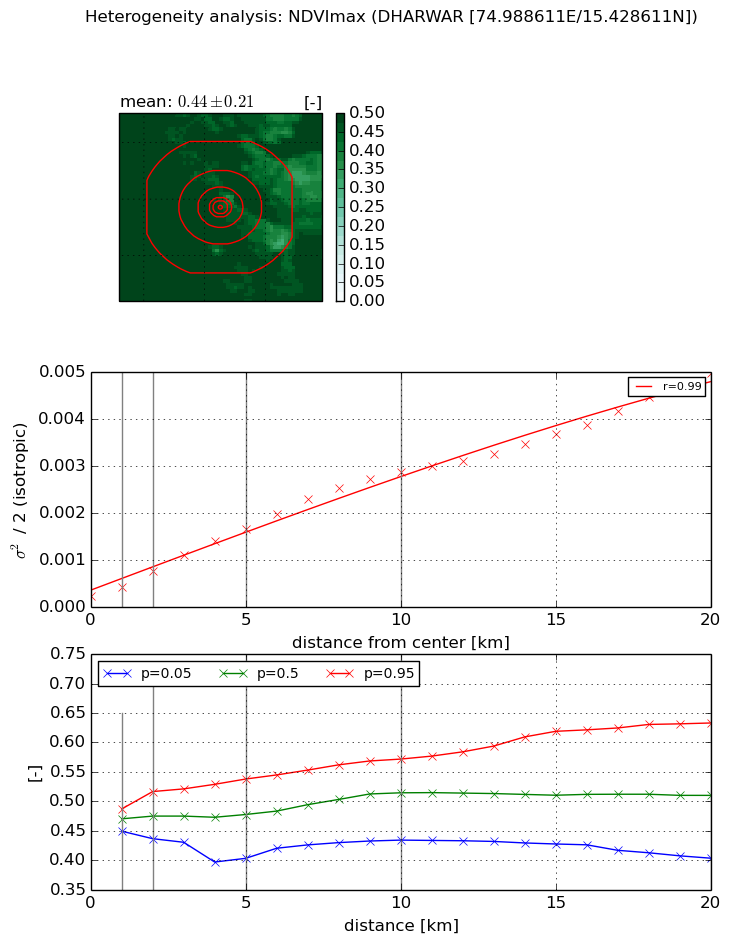
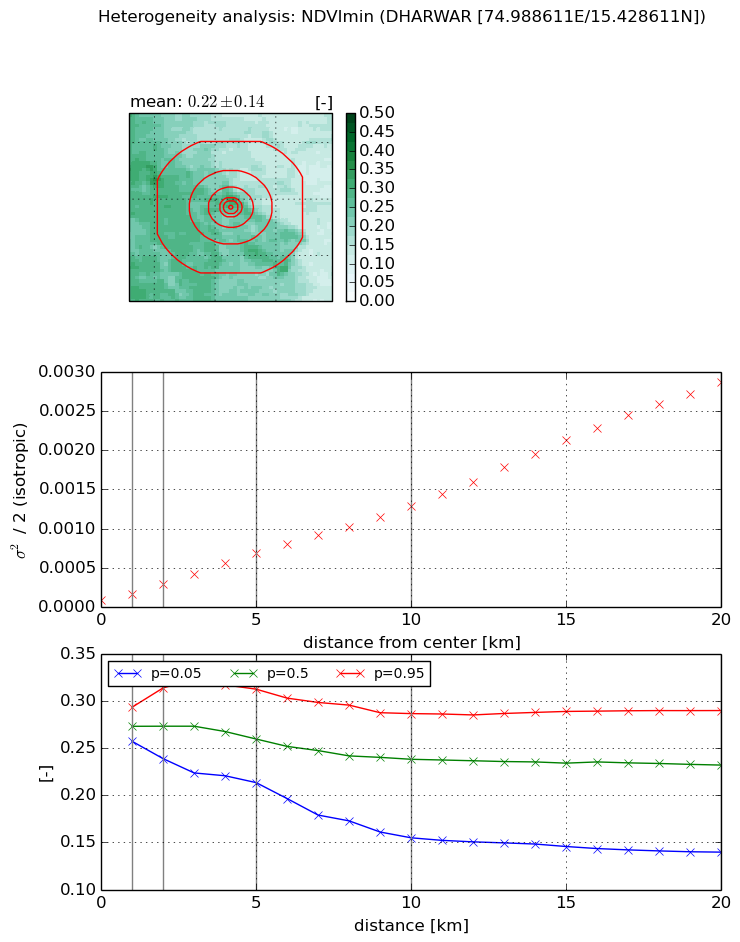
Heterogeneity analysis

The heterogeneity analysis provides information about the spatial and temporal heterogeneity of the site.

Topography


Roman et al. (2009) index


St

6.06629998252

Rcv

0.0872568064862

Rse

0.0

Rst

-4.02203113204e-07

Rsv

-0.407278176742


Height range @ 1km [m]

76

Height range @ 2km [m]

82

Height range @ 5km [m]

98

Height range @ 10km [m]

-999

Height range @ 20km [m]

-999


Variance slope @ 1 km

187

Variance slope @ 2 km

181

Variance slope @ 5 km

230

Variance slope @ 10 km

-999

Variance slope @ 20 km

-999


NDVI (max. NDVI composite)


Roman et al. (2009) index


St

2.07467573371

Rcv

0.323875660173

Rse

0.0

Rst

0.0131394324542

Rsv

1.10899401195


NDVI range @ 1km [-]

0.04

NDVI range @ 2km [-]

0.08

NDVI range @ 5km [-]

0.13

NDVI range @ 10km [-]

0.14

NDVI range @ 20km [-]

0.23


Variance slope @ 1 km

0.000199601804923

Variance slope @ 2 km

0.000263296001039

Variance slope @ 5 km

0.000296971592407

Variance slope @ 10 km

0.000278239396991

Variance slope @ 20 km

0.000223809894194


NDVI (min. NDVI composite)I


Roman et al. (2009) index


St

6.36869069533e-07

Rcv

-0.011349481444

Rse

0.0

Rst

0.66889866013

Rsv

4710543.67418


NDVI range @ 1km [-]

0.04

NDVI range @ 2km [-]

0.08

NDVI range @ 5km [-]

0.1

NDVI range @ 10km [-]

0.13

NDVI range @ 20km [-]

0.15


NDVI slope @ 1 km

7.47768838148e-05

NDVI slope @ 2 km

0.000102568870227

NDVI slope @ 5 km

0.000124633358178

NDVI slope @ 10 km

0.000121794758522

NDVI slope @ 20 km

0.000142263420027


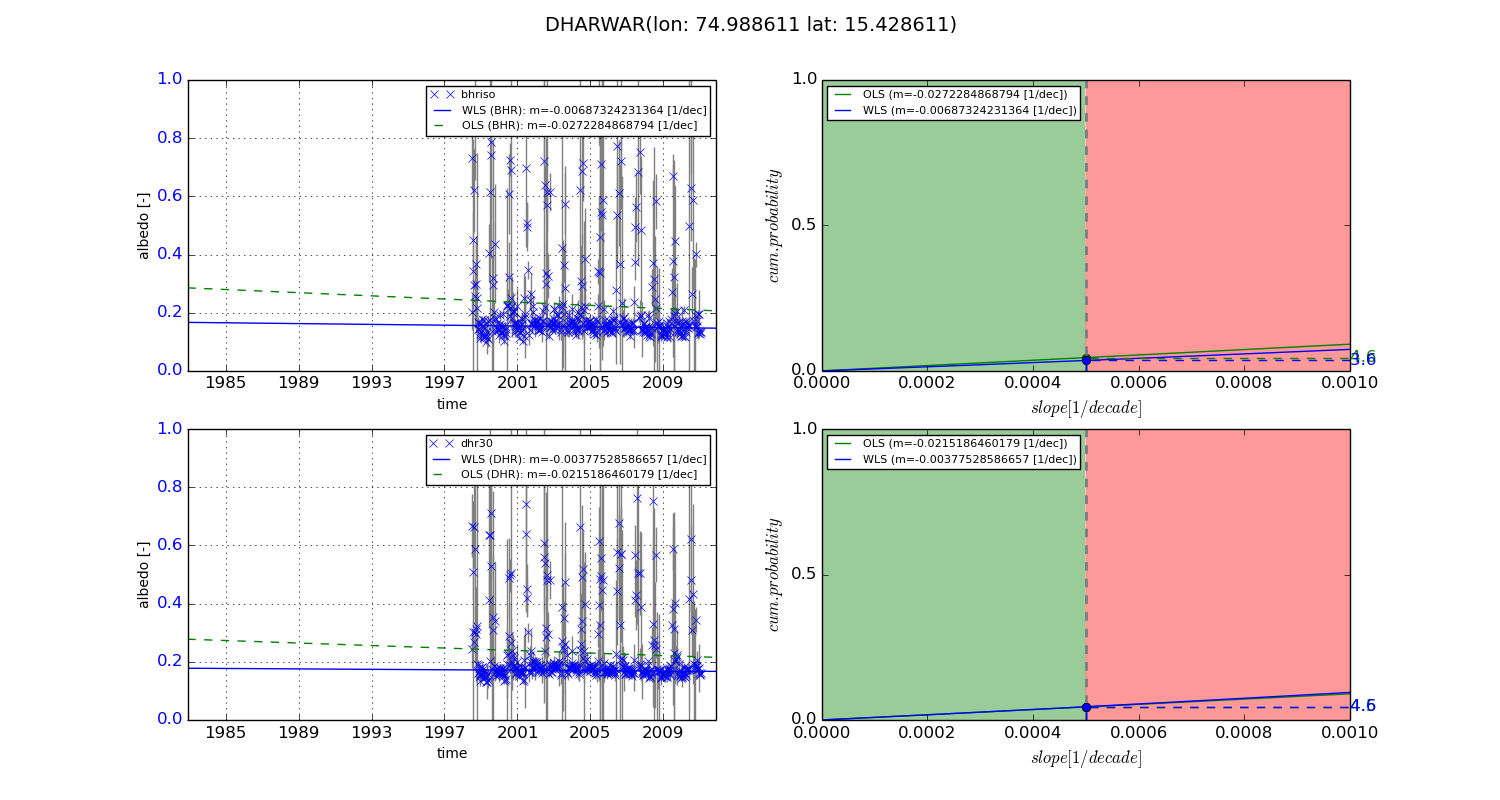
Temporal stability analysis

+000 deg (BHR)


BHR statistics

Temporal stability [1/decade]:


abs

rel


Weighted least square:

-99999.0


Ordinary least square:

-99999.0


Probabilities that GCOS criteria is met:

Weighted least square:

-99999.0 %

Ordinary least square:

-99999.0 %


DHR statistics

Temporal stability [1/decade]:


abs

rel


Weighted least square:

-99999.0


Ordinary least square:

-99999.0


Probabilities that GCOS criteria is met:

Weighted least square:

-99999.0 %

Ordinary least square:

-99999.0 %


+057/+063 deg (BHR)


BHR statistics

Temporal stability [1/decade]:


abs

rel


Weighted least square:

-0.00687324231364


Ordinary least square:

-0.0272284868794


Probabilities that GCOS criteria is met:

Weighted least square:

3.6 %

Ordinary least square:

4.6 %


DHR statistics

Temporal stability [1/decade]:


abs

rel


Weighted least square:

-0.00377528586657


Ordinary least square:

-0.0215186460179


Probabilities that GCOS criteria is met:

Weighted least square:

4.6 %

Ordinary least square:

4.5 %


Temporal anomaly analyis

The variance of the temporal anomalies provides an additional measure about the stability of the signal AFTER removal of the mean seasonal cylce.

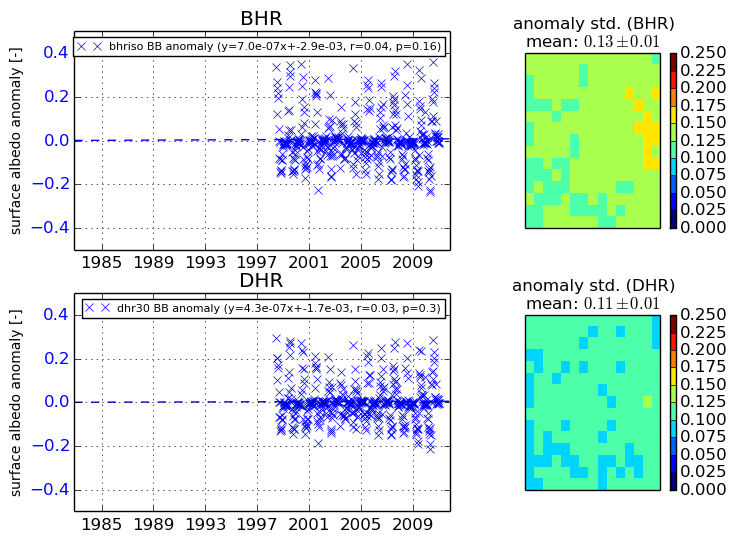
+000 deg


+057/+063 deg