DHULIKEL


Location

lon / lat [deg]: 85.554 / 27.6205

Source network: AERONET


Geostationary surface albedo (GSA) data


“+000”


“+057/+063”


Landcover information (based on ESA CCI landcover data)


Landcover fractions @ 2km distance


Landcover fractions @ 20 km distance


Legend


Distance to open water bodies [km]:

38.77

Distance to urban areas [km]:

3.27


Radius: 1 km

Number of landcover classes:

8

Dominant landcover type:

40: mosaic natural vegetation (tree, shrub, herbaceous cover) (>50%) / cropland (<50%)

Fraction of dominant landcover type [%]:

31.0


Radius: 2 km

Number of landcover classes:

8

Dominant landcover type:

40: mosaic natural vegetation (tree, shrub, herbaceous cover) (>50%) / cropland (<50%)

Fraction of dominant landcover type [%]:

28.0


Radius: 5 km

Number of landcover classes:

8

Dominant landcover type:

40: mosaic natural vegetation (tree, shrub, herbaceous cover) (>50%) / cropland (<50%)

Fraction of dominant landcover type [%]:

30.0


Radius: 10 km

Number of landcover classes:

8

Dominant landcover type:

40: mosaic natural vegetation (tree, shrub, herbaceous cover) (>50%) / cropland (<50%)

Fraction of dominant landcover type [%]:

30.0


Radius: 20 km

Number of landcover classes:

9

Dominant landcover type:

40: mosaic natural vegetation (tree, shrub, herbaceous cover) (>50%) / cropland (<50%)

Fraction of dominant landcover type [%]:

24.0


Disturbances


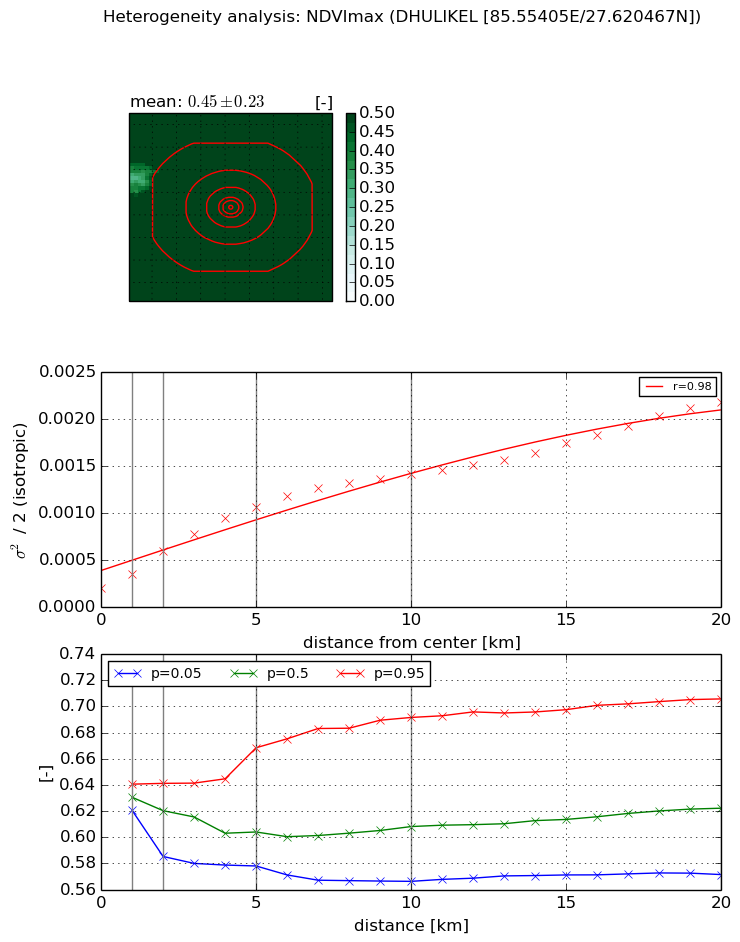
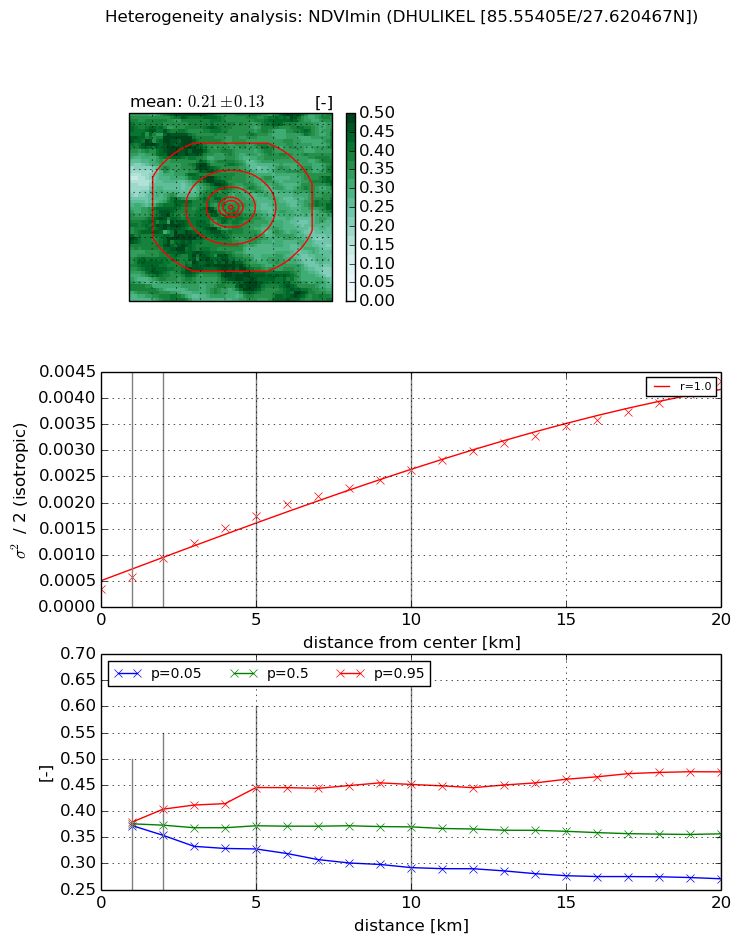
Heterogeneity analysis

The heterogeneity analysis provides information about the spatial and temporal heterogeneity of the site.

Topography


Roman et al. (2009) index


St

4.96126936078

Rcv

0.375607252987

Rse

0.0

Rst

-0.077811533394

Rsv

-0.151265172873


Height range @ 1km [m]

286

Height range @ 2km [m]

505

Height range @ 5km [m]

679

Height range @ 10km [m]

-999

Height range @ 20km [m]

-999


Variance slope @ 1 km

9153

Variance slope @ 2 km

10001

Variance slope @ 5 km

9131

Variance slope @ 10 km

-999

Variance slope @ 20 km

-999


NDVI (max. NDVI composite)


Roman et al. (2009) index


St

4.06218388987

Rcv

0.391696710173

Rse

0.0

Rst

-1.05350732805e-08

Rsv

-0.346822283191


NDVI range @ 1km [-]

0.02

NDVI range @ 2km [-]

0.06

NDVI range @ 5km [-]

0.09

NDVI range @ 10km [-]

0.13

NDVI range @ 20km [-]

0.13


Variance slope @ 1 km

0.00014675850369

Variance slope @ 2 km

0.000197265093275

Variance slope @ 5 km

0.000179614468736

Variance slope @ 10 km

0.000123136190353

Variance slope @ 20 km

8.73536352556e-05


NDVI (min. NDVI composite)I


Roman et al. (2009) index


St

nan

Rcv

nan

Rse

nan

Rst

nan

Rsv

nan


NDVI range @ 1km [-]

0.01

NDVI range @ 2km [-]

0.05

NDVI range @ 5km [-]

0.12

NDVI range @ 10km [-]

0.16

NDVI range @ 20km [-]

0.2


NDVI slope @ 1 km

0.000224671820649

NDVI slope @ 2 km

0.00029290874708

NDVI slope @ 5 km

0.000285096686281

NDVI slope @ 10 km

0.000227456867283

NDVI slope @ 20 km

0.000186360623124


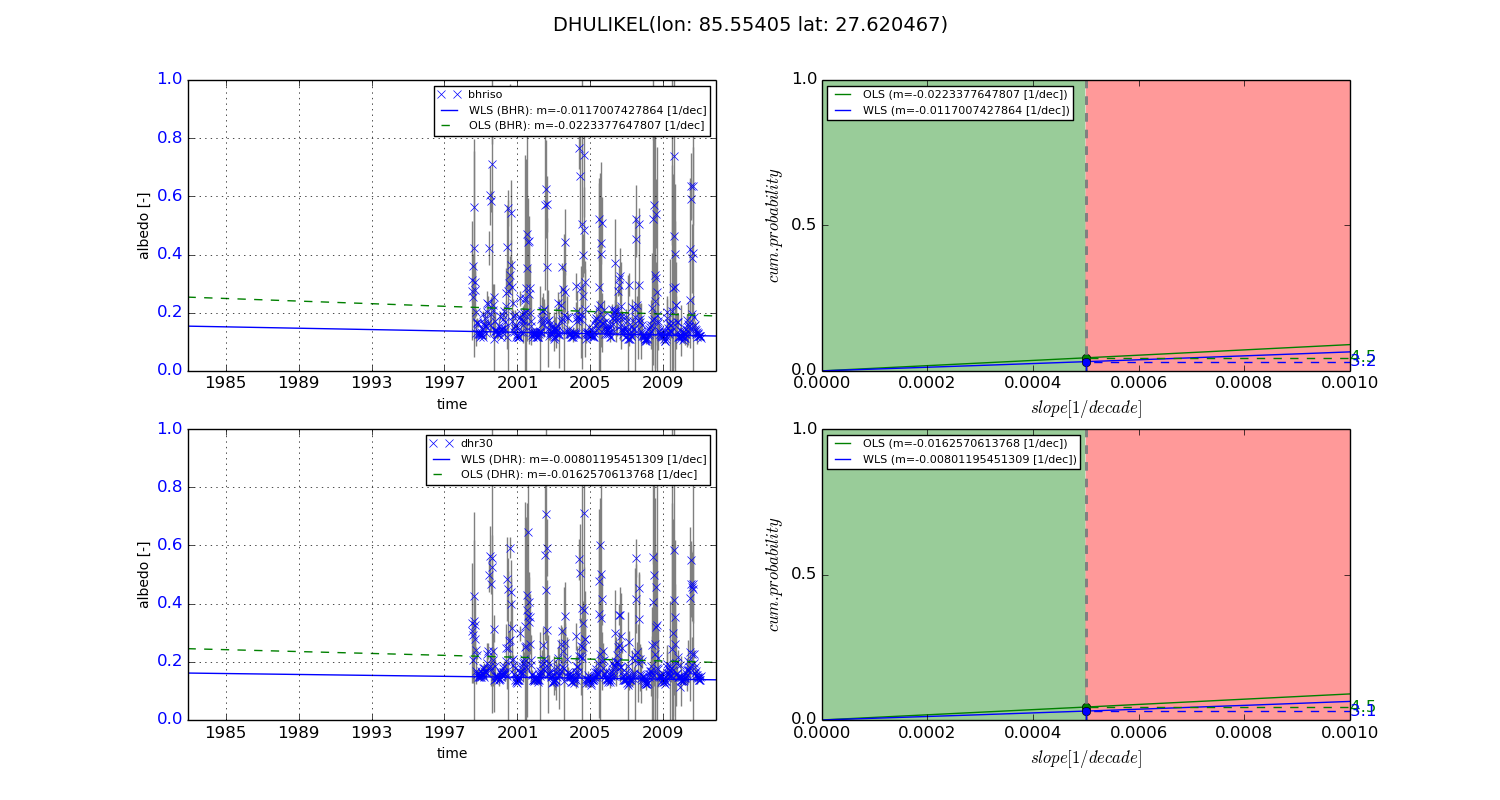
Temporal stability analysis

+000 deg (BHR)


BHR statistics

Temporal stability [1/decade]:


abs

rel


Weighted least square:

None


Ordinary least square:

None


Probabilities that GCOS criteria is met:

Weighted least square:

None %

Ordinary least square:

None %


DHR statistics

Temporal stability [1/decade]:


abs

rel


Weighted least square:

None


Ordinary least square:

None


Probabilities that GCOS criteria is met:

Weighted least square:

None %

Ordinary least square:

None %


+057/+063 deg (BHR)


BHR statistics

Temporal stability [1/decade]:


abs

rel


Weighted least square:

-0.0117007427864


Ordinary least square:

-0.0223377647807


Probabilities that GCOS criteria is met:

Weighted least square:

3.2 %

Ordinary least square:

4.5 %


DHR statistics

Temporal stability [1/decade]:


abs

rel


Weighted least square:

-0.00801195451309


Ordinary least square:

-0.0162570613768


Probabilities that GCOS criteria is met:

Weighted least square:

3.1 %

Ordinary least square:

4.5 %


Temporal anomaly analyis

The variance of the temporal anomalies provides an additional measure about the stability of the signal AFTER removal of the mean seasonal cylce.

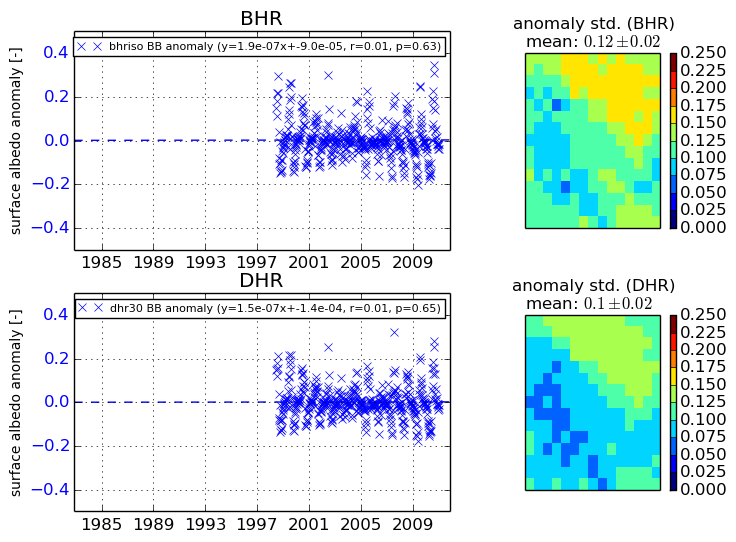
+000 deg


+057/+063 deg