DIRECT_00001


Location

lon / lat [deg]: -88.2917 / 40.0066

Source network: DIRECT


Geostationary surface albedo (GSA) data


“+000”


“+057/+063”


Landcover information (based on ESA CCI landcover data)


Landcover fractions @ 2km distance


Landcover fractions @ 20 km distance


Legend


Distance to open water bodies [km]:

15.68

Distance to urban areas [km]:

3.11


Radius: 1 km

Number of landcover classes:

1

Dominant landcover type:

10: cropland, rainfed

Fraction of dominant landcover type [%]:

100.0


Radius: 2 km

Number of landcover classes:

1

Dominant landcover type:

10: cropland, rainfed

Fraction of dominant landcover type [%]:

100.0


Radius: 5 km

Number of landcover classes:

3

Dominant landcover type:

10: cropland, rainfed

Fraction of dominant landcover type [%]:

93.0


Radius: 10 km

Number of landcover classes:

3

Dominant landcover type:

10: cropland, rainfed

Fraction of dominant landcover type [%]:

92.0


Radius: 20 km

Number of landcover classes:

2

Dominant landcover type:

10: cropland, rainfed

Fraction of dominant landcover type [%]:

92.0


Disturbances


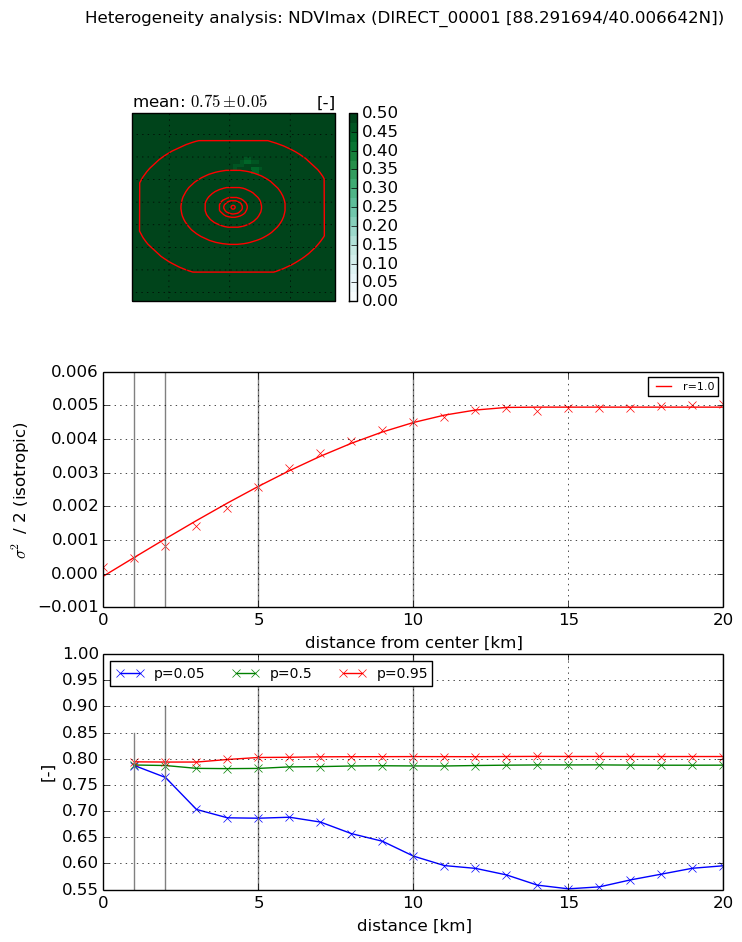
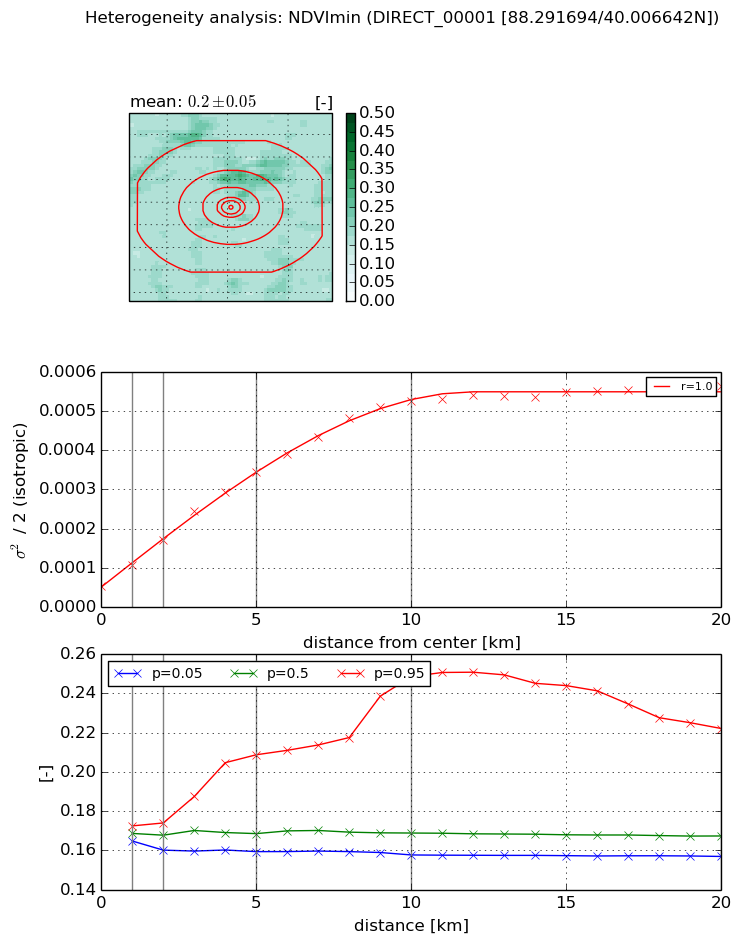
Heterogeneity analysis

The heterogeneity analysis provides information about the spatial and temporal heterogeneity of the site.

Topography


Roman et al. (2009) index


St

0.00578666755226

Rcv

0.0532583764554

Rse

0.0

Rst

2.87010419564e-05

Rsv

518.379813305


Height range @ 1km [m]

12

Height range @ 2km [m]

17

Height range @ 5km [m]

20

Height range @ 10km [m]

-999

Height range @ 20km [m]

-999


Variance slope @ 1 km

6

Variance slope @ 2 km

8

Variance slope @ 5 km

11

Variance slope @ 10 km

-999

Variance slope @ 20 km

-999


NDVI (max. NDVI composite)


Roman et al. (2009) index


St

4.05473601679

Rcv

0.251212836663

Rse

0.0

Rst

0.200390834102

Rsv

-0.288271869239


NDVI range @ 1km [-]

0.01

NDVI range @ 2km [-]

0.03

NDVI range @ 5km [-]

0.12

NDVI range @ 10km [-]

0.19

NDVI range @ 20km [-]

0.21


Variance slope @ 1 km

0.000261809958203

Variance slope @ 2 km

0.00031210332679

Variance slope @ 5 km

0.000481785342899

Variance slope @ 10 km

0.000469324794324

Variance slope @ 20 km

0.000245994410304


NDVI (min. NDVI composite)I


Roman et al. (2009) index


St

1.24927470447

Rcv

1.18322854052

Rse

0.0

Rst

-0.218165496262

Rsv

-0.999999339124


NDVI range @ 1km [-]

0.01

NDVI range @ 2km [-]

0.01

NDVI range @ 5km [-]

0.05

NDVI range @ 10km [-]

0.09

NDVI range @ 20km [-]

0.07


NDVI slope @ 1 km

5.48827724614e-05

NDVI slope @ 2 km

5.88631038584e-05

NDVI slope @ 5 km

5.96521202442e-05

NDVI slope @ 10 km

4.89446895591e-05

NDVI slope @ 20 km

2.34727223466e-05


Temporal stability analysis

+000 deg (BHR)


BHR statistics

Temporal stability [1/decade]:


abs

rel


Weighted least square:

None


Ordinary least square:

None


Probabilities that GCOS criteria is met:

Weighted least square:

None %

Ordinary least square:

None %


DHR statistics

Temporal stability [1/decade]:


abs

rel


Weighted least square:

None


Ordinary least square:

None


Probabilities that GCOS criteria is met:

Weighted least square:

None %

Ordinary least square:

None %


+057/+063 deg (BHR)


BHR statistics

Temporal stability [1/decade]:


abs

rel


Weighted least square:

None


Ordinary least square:

None


Probabilities that GCOS criteria is met:

Weighted least square:

None %

Ordinary least square:

None %


DHR statistics

Temporal stability [1/decade]:


abs

rel


Weighted least square:

None


Ordinary least square:

None


Probabilities that GCOS criteria is met:

Weighted least square:

None %

Ordinary least square:

None %


Temporal anomaly analyis

The variance of the temporal anomalies provides an additional measure about the stability of the signal AFTER removal of the mean seasonal cylce.

+000 deg


+057/+063 deg