DIRECT_00002


Location

lon / lat [deg]: -90.2727 / 45.9453

Source network: DIRECT


Geostationary surface albedo (GSA) data


“+000”


“+057/+063”


Landcover information (based on ESA CCI landcover data)


Landcover fractions @ 2km distance


Landcover fractions @ 20 km distance


Legend


Distance to open water bodies [km]:

2.95

Distance to urban areas [km]:

10.0


Radius: 1 km

Number of landcover classes:

5

Dominant landcover type:

90: Tree cover, mixed leaf type

Fraction of dominant landcover type [%]:

48.0


Radius: 2 km

Number of landcover classes:

5

Dominant landcover type:

160: Tree cover, flooded, fresh or brakish water

Fraction of dominant landcover type [%]:

37.0


Radius: 5 km

Number of landcover classes:

6

Dominant landcover type:

160: Tree cover, flooded, fresh or brakish water

Fraction of dominant landcover type [%]:

43.0


Radius: 10 km

Number of landcover classes:

7

Dominant landcover type:

160: Tree cover, flooded, fresh or brakish water

Fraction of dominant landcover type [%]:

41.0


Radius: 20 km

Number of landcover classes:

9

Dominant landcover type:

160: Tree cover, flooded, fresh or brakish water

Fraction of dominant landcover type [%]:

30.0


Disturbances


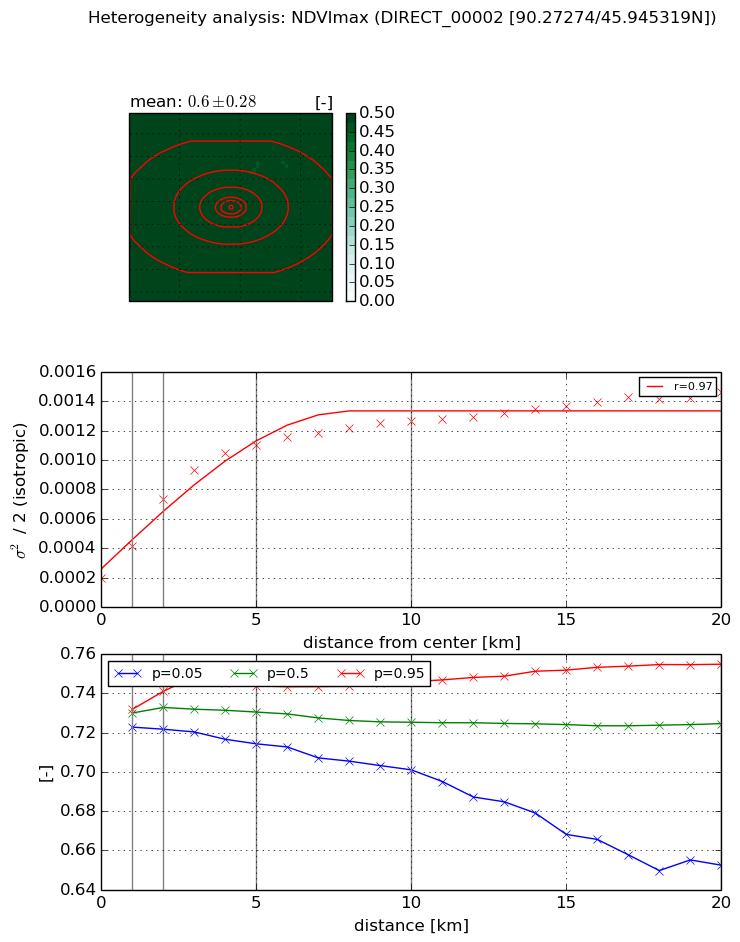
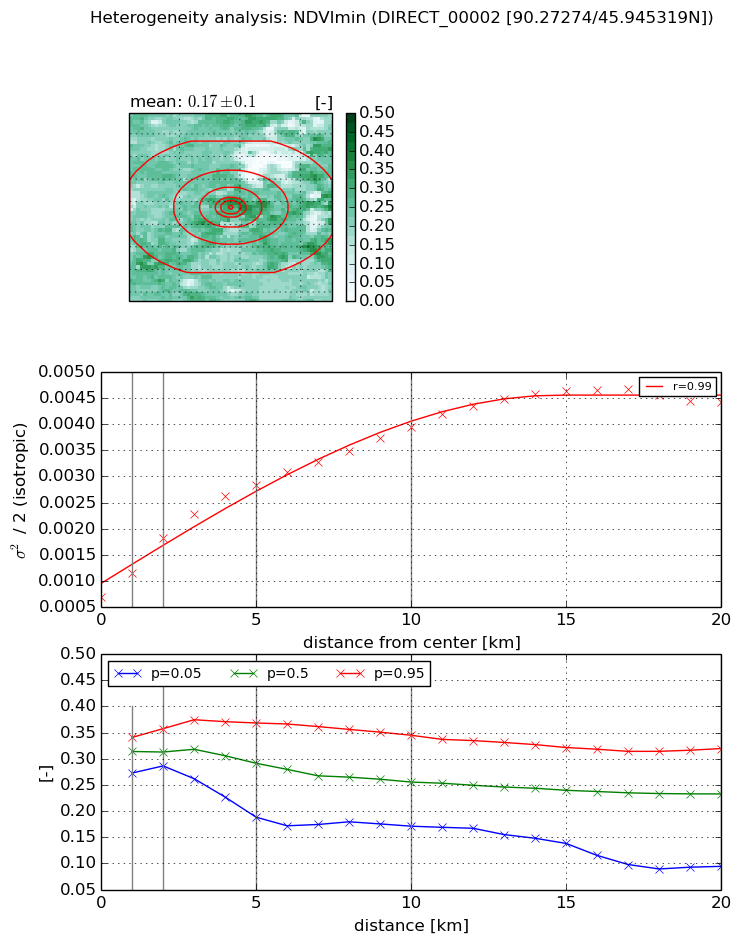
Heterogeneity analysis

The heterogeneity analysis provides information about the spatial and temporal heterogeneity of the site.

Topography


Roman et al. (2009) index


St

4.49603167886

Rcv

0.144099754165

Rse

0.0

Rst

-0.0238460117427

Rsv

-0.499309319083


Height range @ 1km [m]

20

Height range @ 2km [m]

26

Height range @ 5km [m]

30

Height range @ 10km [m]

-999

Height range @ 20km [m]

-999


Variance slope @ 1 km

38

Variance slope @ 2 km

22

Variance slope @ 5 km

12

Variance slope @ 10 km

-999

Variance slope @ 20 km

-999


NDVI (max. NDVI composite)


Roman et al. (2009) index


St

1.32355620174

Rcv

0.122259614658

Rse

0.0

Rst

-0.460247675309

Rsv

1.68411349732


NDVI range @ 1km [-]

0.01

NDVI range @ 2km [-]

0.02

NDVI range @ 5km [-]

0.03

NDVI range @ 10km [-]

0.04

NDVI range @ 20km [-]

0.1


Variance slope @ 1 km

0.000217987835083

Variance slope @ 2 km

0.000268625904227

Variance slope @ 5 km

0.000189311016976

Variance slope @ 10 km

9.76874318543e-05

Variance slope @ 20 km

4.59171154914e-05


NDVI (min. NDVI composite)I


Roman et al. (2009) index


St

2.09721827574e-07

Rcv

0.551824375408

Rse

0.0

Rst

0.106468795589

Rsv

14304662.0213


NDVI range @ 1km [-]

0.07

NDVI range @ 2km [-]

0.07

NDVI range @ 5km [-]

0.18

NDVI range @ 10km [-]

0.17

NDVI range @ 20km [-]

0.23


NDVI slope @ 1 km

0.000469204501188

NDVI slope @ 2 km

0.000566467419733

NDVI slope @ 5 km

0.000445227082953

NDVI slope @ 10 km

0.00030948564295

NDVI slope @ 20 km

0.000180184470697


Temporal stability analysis

+000 deg (BHR)


BHR statistics

Temporal stability [1/decade]:


abs

rel


Weighted least square:

None


Ordinary least square:

None


Probabilities that GCOS criteria is met:

Weighted least square:

None %

Ordinary least square:

None %


DHR statistics

Temporal stability [1/decade]:


abs

rel


Weighted least square:

None


Ordinary least square:

None


Probabilities that GCOS criteria is met:

Weighted least square:

None %

Ordinary least square:

None %


+057/+063 deg (BHR)


BHR statistics

Temporal stability [1/decade]:


abs

rel


Weighted least square:

None


Ordinary least square:

None


Probabilities that GCOS criteria is met:

Weighted least square:

None %

Ordinary least square:

None %


DHR statistics

Temporal stability [1/decade]:


abs

rel


Weighted least square:

None


Ordinary least square:

None


Probabilities that GCOS criteria is met:

Weighted least square:

None %

Ordinary least square:

None %


Temporal anomaly analyis

The variance of the temporal anomalies provides an additional measure about the stability of the signal AFTER removal of the mean seasonal cylce.

+000 deg


+057/+063 deg