DIRECT_00005


Location

lon / lat [deg]: -121.573 / 44.4508

Source network: DIRECT


Geostationary surface albedo (GSA) data


“+000”


“+057/+063”


Landcover information (based on ESA CCI landcover data)


Landcover fractions @ 2km distance


Landcover fractions @ 20 km distance


Legend


Distance to open water bodies [km]:

8.62

Distance to urban areas [km]:

12.18


Radius: 1 km

Number of landcover classes:

1

Dominant landcover type:

70: Tree cover, needleleaved, evergreen, closed to open (>15%)

Fraction of dominant landcover type [%]:

100.0


Radius: 2 km

Number of landcover classes:

1

Dominant landcover type:

70: Tree cover, needleleaved, evergreen, closed to open (>15%)

Fraction of dominant landcover type [%]:

100.0


Radius: 5 km

Number of landcover classes:

1

Dominant landcover type:

70: Tree cover, needleleaved, evergreen, closed to open (>15%)

Fraction of dominant landcover type [%]:

100.0


Radius: 10 km

Number of landcover classes:

2

Dominant landcover type:

70: Tree cover, needleleaved, evergreen, closed to open (>15%)

Fraction of dominant landcover type [%]:

98.0


Radius: 20 km

Number of landcover classes:

4

Dominant landcover type:

70: Tree cover, needleleaved, evergreen, closed to open (>15%)

Fraction of dominant landcover type [%]:

74.0


Disturbances


Heterogeneity analysis

The heterogeneity analysis provides information about the spatial and temporal heterogeneity of the site.

Topography


Roman et al. (2009) index


St

4.43336076455

Rcv

0.596734566742

Rse

0.0

Rst

-0.0315640679364

Rsv

-0.0483889076459


Height range @ 1km [m]

97

Height range @ 2km [m]

164

Height range @ 5km [m]

400

Height range @ 10km [m]

-999

Height range @ 20km [m]

-999


Variance slope @ 1 km

3431

Variance slope @ 2 km

4630

Variance slope @ 5 km

3955

Variance slope @ 10 km

-999

Variance slope @ 20 km

-999


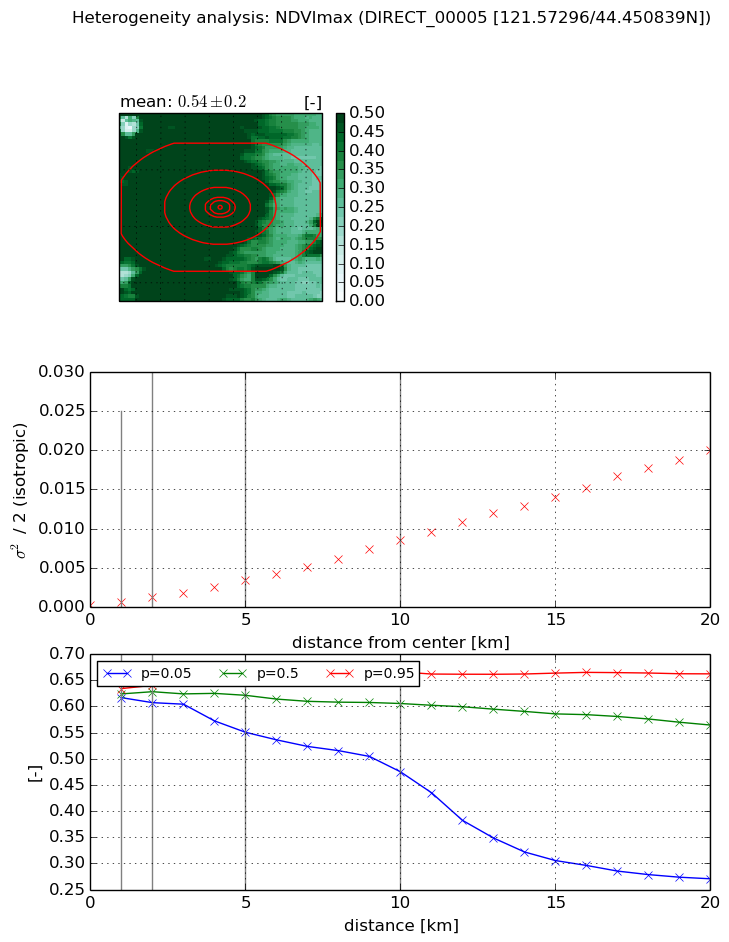
NDVI (max. NDVI composite)


Roman et al. (2009) index


St

1.51939202527

Rcv

1.0068841622

Rse

0.0

Rst

-6.57922851946e-08

Rsv

-0.967589739301


NDVI range @ 1km [-]

0.02

NDVI range @ 2km [-]

0.03

NDVI range @ 5km [-]

0.11

NDVI range @ 10km [-]

0.19

NDVI range @ 20km [-]

0.39


Variance slope @ 1 km

0.000367224645687

Variance slope @ 2 km

0.000477829214789

Variance slope @ 5 km

0.000635059824696

Variance slope @ 10 km

0.000828833059431

Variance slope @ 20 km

0.00102724445163


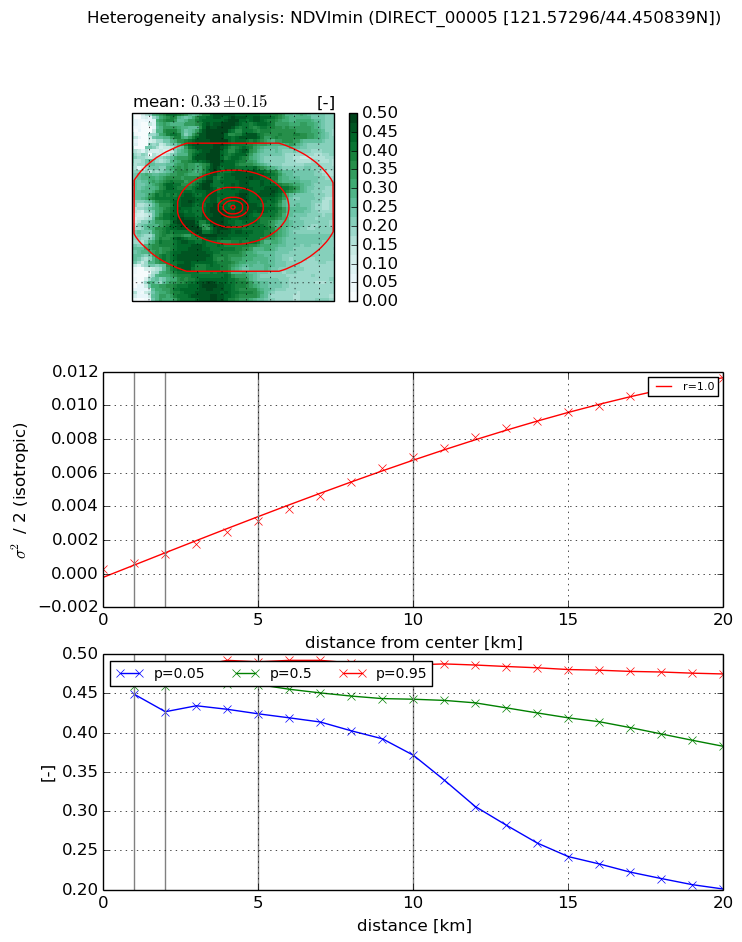
NDVI (min. NDVI composite)I


Roman et al. (2009) index


St

4.02393636479

Rcv

0.186817179921

Rse

0.0

Rst

-0.0905957684484

Rsv

0.468125680484


NDVI range @ 1km [-]

0.02

NDVI range @ 2km [-]

0.06

NDVI range @ 5km [-]

0.07

NDVI range @ 10km [-]

0.12

NDVI range @ 20km [-]

0.27


NDVI slope @ 1 km

0.000337686804378

NDVI slope @ 2 km

0.000443706974967

NDVI slope @ 5 km

0.000586159226792

NDVI slope @ 10 km

0.00069119562506

NDVI slope @ 20 km

0.000605640806411


Temporal stability analysis

+000 deg (BHR)


BHR statistics

Temporal stability [1/decade]:


abs

rel


Weighted least square:

None


Ordinary least square:

None


Probabilities that GCOS criteria is met:

Weighted least square:

None %

Ordinary least square:

None %


DHR statistics

Temporal stability [1/decade]:


abs

rel


Weighted least square:

None


Ordinary least square:

None


Probabilities that GCOS criteria is met:

Weighted least square:

None %

Ordinary least square:

None %


+057/+063 deg (BHR)


BHR statistics

Temporal stability [1/decade]:


abs

rel


Weighted least square:

None


Ordinary least square:

None


Probabilities that GCOS criteria is met:

Weighted least square:

None %

Ordinary least square:

None %


DHR statistics

Temporal stability [1/decade]:


abs

rel


Weighted least square:

None


Ordinary least square:

None


Probabilities that GCOS criteria is met:

Weighted least square:

None %

Ordinary least square:

None %


Temporal anomaly analyis

The variance of the temporal anomalies provides an additional measure about the stability of the signal AFTER removal of the mean seasonal cylce.

+000 deg


+057/+063 deg


By continuing to use this website, you are giving consent to analytic cookies being used. For more information on how EUMETSAT uses data and how you can disable this, please view this web page: Analytics Cookie Policy