DIRECT_00012


Location

lon / lat [deg]: 28.7113 / 61.5265

Source network: DIRECT


Geostationary surface albedo (GSA) data


“+000”


“+057/+063”


Landcover information (based on ESA CCI landcover data)


Landcover fractions @ 2km distance


Landcover fractions @ 20 km distance


Legend


Distance to open water bodies [km]:

0.91

Distance to urban areas [km]:

20.38


Radius: 1 km

Number of landcover classes:

3

Dominant landcover type:

70: Tree cover, needleleaved, evergreen, closed to open (>15%)

Fraction of dominant landcover type [%]:

97.0


Radius: 2 km

Number of landcover classes:

2

Dominant landcover type:

70: Tree cover, needleleaved, evergreen, closed to open (>15%)

Fraction of dominant landcover type [%]:

97.0


Radius: 5 km

Number of landcover classes:

2

Dominant landcover type:

70: Tree cover, needleleaved, evergreen, closed to open (>15%)

Fraction of dominant landcover type [%]:

88.0


Radius: 10 km

Number of landcover classes:

3

Dominant landcover type:

70: Tree cover, needleleaved, evergreen, closed to open (>15%)

Fraction of dominant landcover type [%]:

79.0


Radius: 20 km

Number of landcover classes:

3

Dominant landcover type:

70: Tree cover, needleleaved, evergreen, closed to open (>15%)

Fraction of dominant landcover type [%]:

77.0


Disturbances


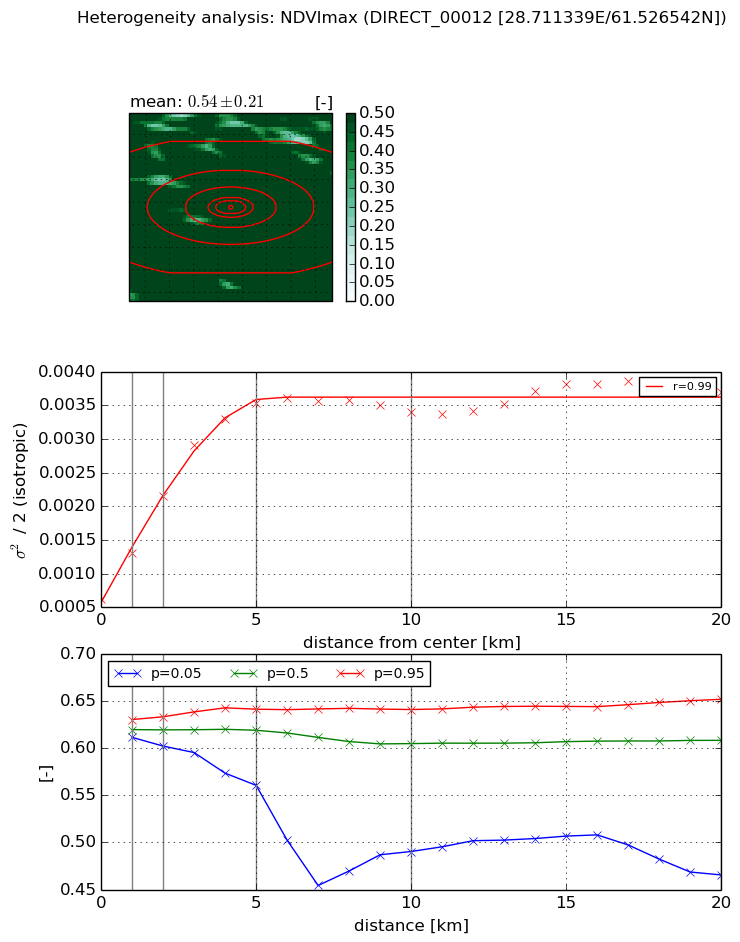
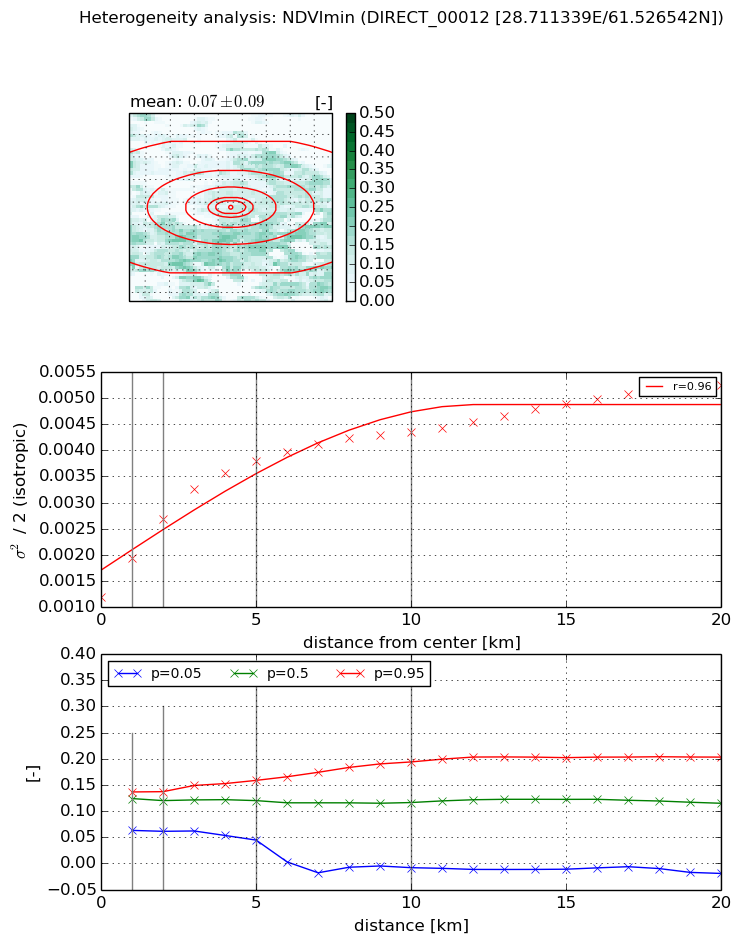
Heterogeneity analysis

The heterogeneity analysis provides information about the spatial and temporal heterogeneity of the site.

Topography


Roman et al. (2009) index


St

19.0033565113

Rcv

0.111871604796

Rse

0.0

Rst

-0.0138870176424

Rsv

0.0321082258847


Height range @ 1km [m]

17

Height range @ 2km [m]

29

Height range @ 5km [m]

34

Height range @ 10km [m]

-999

Height range @ 20km [m]

-999


Variance slope @ 1 km

94

Variance slope @ 2 km

58

Variance slope @ 5 km

22

Variance slope @ 10 km

-999

Variance slope @ 20 km

-999


NDVI (max. NDVI composite)


Roman et al. (2009) index


St

0.078931348088

Rcv

1.57711009762

Rse

0.0

Rst

1.44418194792e-07

Rsv

36.4306024434


NDVI range @ 1km [-]

0.02

NDVI range @ 2km [-]

0.03

NDVI range @ 5km [-]

0.08

NDVI range @ 10km [-]

0.15

NDVI range @ 20km [-]

0.19


Variance slope @ 1 km

0.000690988578533

Variance slope @ 2 km

0.000769355340483

Variance slope @ 5 km

0.000609245061581

Variance slope @ 10 km

0.000260195840067

Variance slope @ 20 km

9.94098568418e-05


NDVI (min. NDVI composite)I


Roman et al. (2009) index


St

1.76639459288

Rcv

0.41358161215

Rse

0.0

Rst

-0.28479357134

Rsv

-0.999999580615


NDVI range @ 1km [-]

0.07

NDVI range @ 2km [-]

0.08

NDVI range @ 5km [-]

0.11

NDVI range @ 10km [-]

0.2

NDVI range @ 20km [-]

0.22


NDVI slope @ 1 km

0.000750127574148

NDVI slope @ 2 km

0.000752253527857

NDVI slope @ 5 km

0.000529108564088

NDVI slope @ 10 km

0.00028984364462

NDVI slope @ 20 km

0.000157922513504


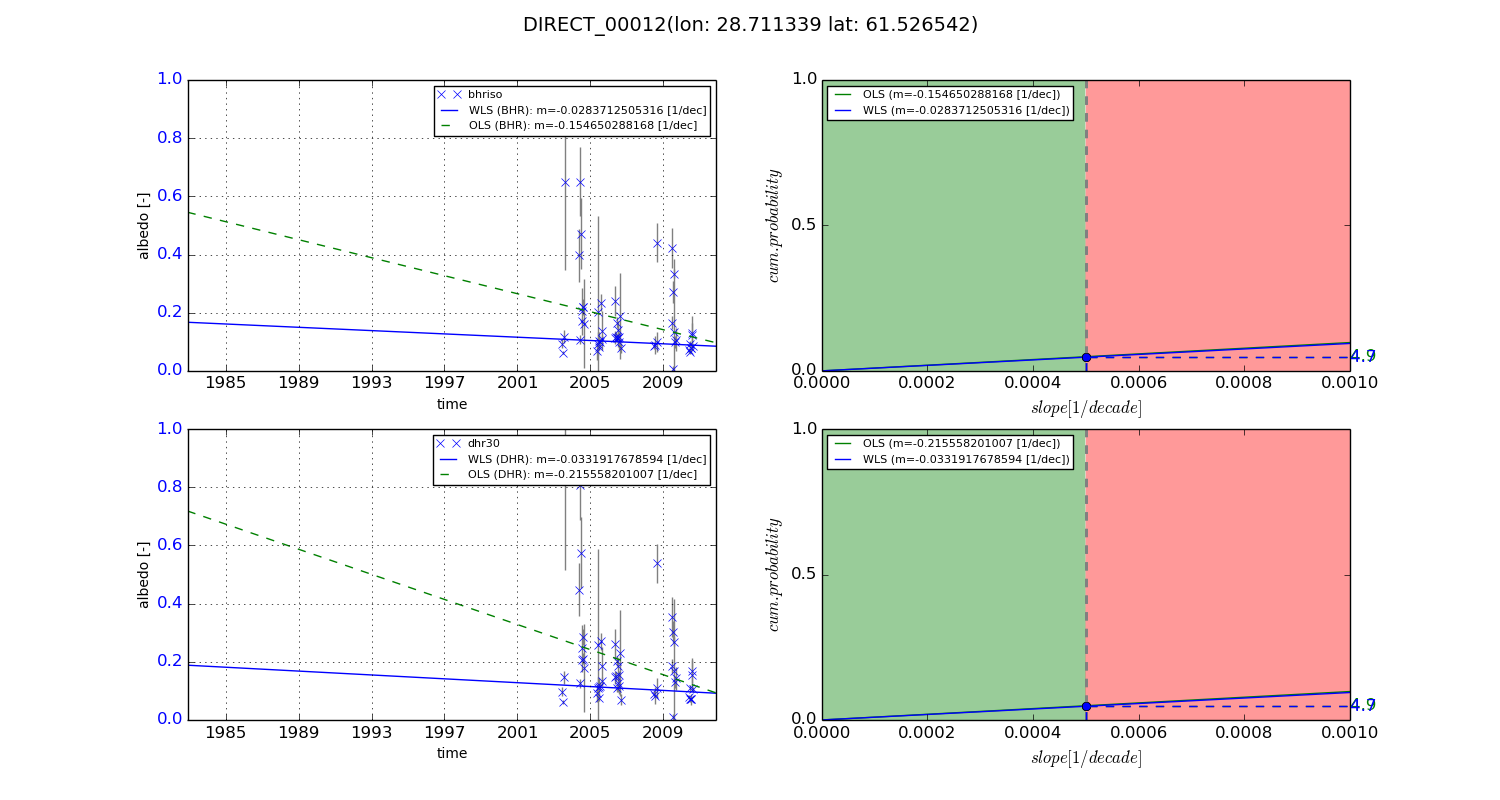
Temporal stability analysis

+000 deg (BHR)


BHR statistics

Temporal stability [1/decade]:


abs

rel


Weighted least square:

-99999.0


Ordinary least square:

-99999.0


Probabilities that GCOS criteria is met:

Weighted least square:

-99999.0 %

Ordinary least square:

-99999.0 %


DHR statistics

Temporal stability [1/decade]:


abs

rel


Weighted least square:

-99999.0


Ordinary least square:

-99999.0


Probabilities that GCOS criteria is met:

Weighted least square:

-99999.0 %

Ordinary least square:

-99999.0 %


+057/+063 deg (BHR)


BHR statistics

Temporal stability [1/decade]:


abs

rel


Weighted least square:

-0.0283712505316


Ordinary least square:

-0.154650288168


Probabilities that GCOS criteria is met:

Weighted least square:

4.7 %

Ordinary least square:

4.9 %


DHR statistics

Temporal stability [1/decade]:


abs

rel


Weighted least square:

-0.0331917678594


Ordinary least square:

-0.215558201007


Probabilities that GCOS criteria is met:

Weighted least square:

4.7 %

Ordinary least square:

4.9 %


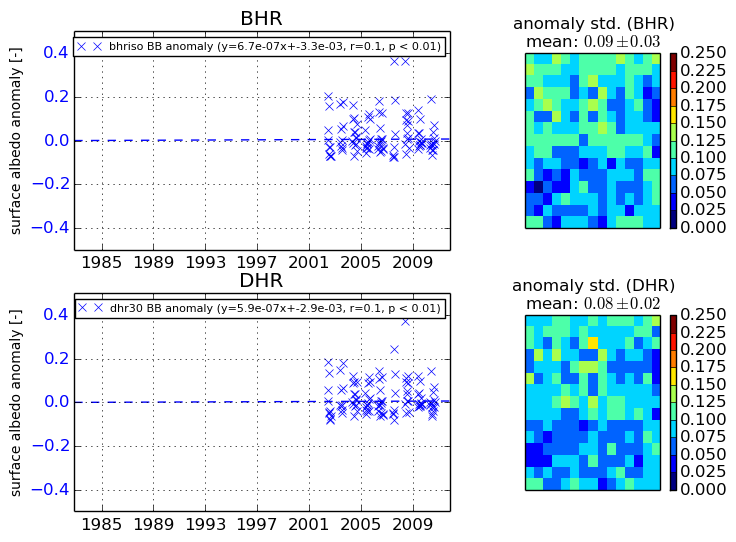
Temporal anomaly analyis

The variance of the temporal anomalies provides an additional measure about the stability of the signal AFTER removal of the mean seasonal cylce.

+000 deg


+057/+063 deg


By continuing to use this website, you are giving consent to analytic cookies being used. For more information on how EUMETSAT uses data and how you can disable this, please view this web page: Analytics Cookie Policy