DIRECT_00020


Location

lon / lat [deg]: -77.6134 / 44.8261

Source network: DIRECT


Geostationary surface albedo (GSA) data


“+000”


“+057/+063”


Landcover information (based on ESA CCI landcover data)


Landcover fractions @ 2km distance


Landcover fractions @ 20 km distance


Legend


Distance to open water bodies [km]:

3.12

Distance to urban areas [km]:

16.9


Radius: 1 km

Number of landcover classes:

2

Dominant landcover type:

62: Tree cover, broadleaved, decidous (open 15-40%)

Fraction of dominant landcover type [%]:

83.0


Radius: 2 km

Number of landcover classes:

4

Dominant landcover type:

62: Tree cover, broadleaved, decidous (open 15-40%)

Fraction of dominant landcover type [%]:

51.0


Radius: 5 km

Number of landcover classes:

5

Dominant landcover type:

62: Tree cover, broadleaved, decidous (open 15-40%)

Fraction of dominant landcover type [%]:

34.0


Radius: 10 km

Number of landcover classes:

7

Dominant landcover type:

61: Tree cover, broadleaved, decidous (closed > 40%)

Fraction of dominant landcover type [%]:

35.0


Radius: 20 km

Number of landcover classes:

7

Dominant landcover type:

61: Tree cover, broadleaved, decidous (closed > 40%)

Fraction of dominant landcover type [%]:

36.0


Disturbances


Heterogeneity analysis

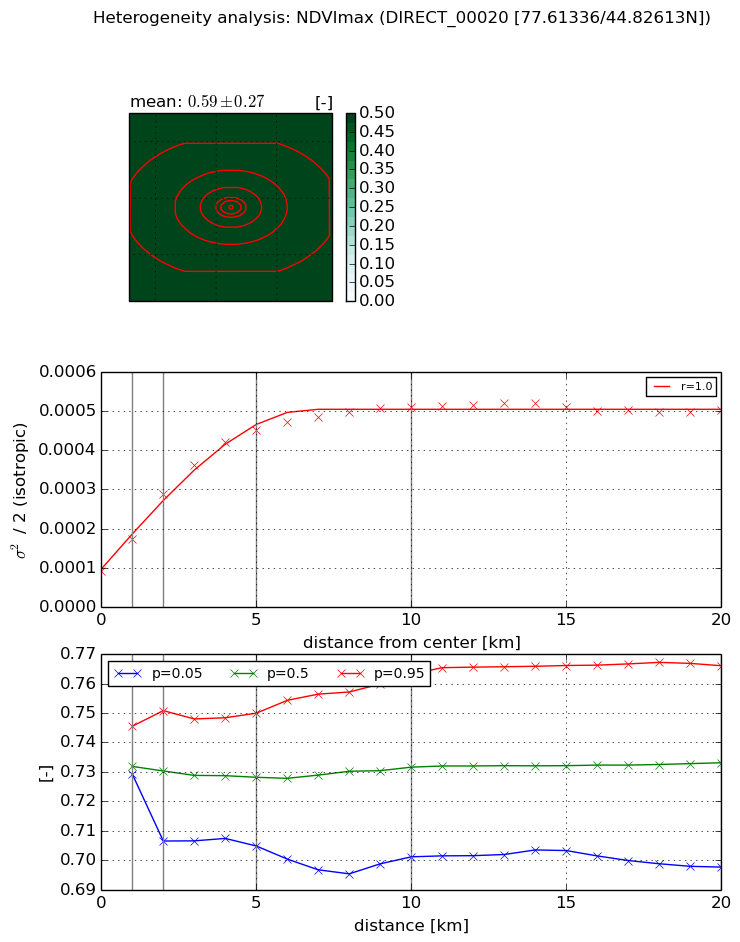
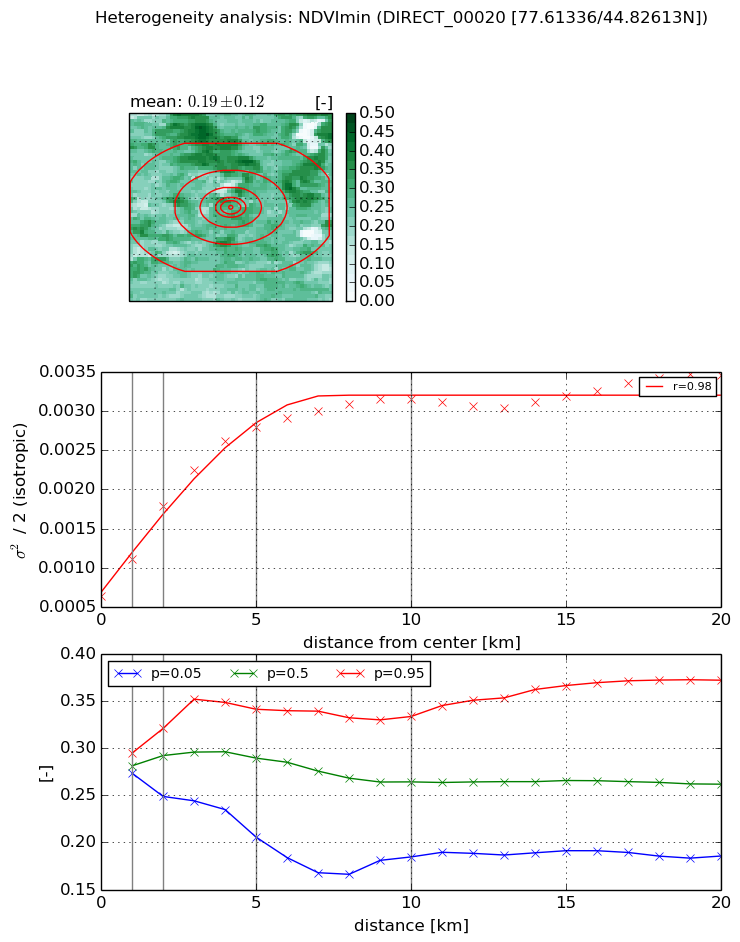
The heterogeneity analysis provides information about the spatial and temporal heterogeneity of the site.

Topography


Roman et al. (2009) index


St

4.99000367716

Rcv

0.0174610632999

Rse

0.0

Rst

-0.17680231764

Rsv

0.40693858084


Height range @ 1km [m]

27

Height range @ 2km [m]

46

Height range @ 5km [m]

41

Height range @ 10km [m]

-999

Height range @ 20km [m]

-999


Variance slope @ 1 km

104

Variance slope @ 2 km

62

Variance slope @ 5 km

22

Variance slope @ 10 km

-999

Variance slope @ 20 km

-999


NDVI (max. NDVI composite)


Roman et al. (2009) index


St

3.82800294535

Rcv

0.168947611782

Rse

0.0

Rst

-0.107913800784

Rsv

0.506837044


NDVI range @ 1km [-]

0.02

NDVI range @ 2km [-]

0.04

NDVI range @ 5km [-]

0.05

NDVI range @ 10km [-]

0.06

NDVI range @ 20km [-]

0.07


Variance slope @ 1 km

8.16771443642e-05

Variance slope @ 2 km

9.78890513451e-05

Variance slope @ 5 km

7.44872425545e-05

Variance slope @ 10 km

3.94726438802e-05

Variance slope @ 20 km

1.40006504112e-05


NDVI (min. NDVI composite)I


Roman et al. (2009) index


St

0.930525927605

Rcv

0.240832392687

Rse

0.0

Rst

-0.552804921331

Rsv

2.43034593137


NDVI range @ 1km [-]

0.02

NDVI range @ 2km [-]

0.07

NDVI range @ 5km [-]

0.14

NDVI range @ 10km [-]

0.15

NDVI range @ 20km [-]

0.19


NDVI slope @ 1 km

0.000467284809316

NDVI slope @ 2 km

0.000575563340783

NDVI slope @ 5 km

0.00045008869322

NDVI slope @ 10 km

0.000240400093711

NDVI slope @ 20 km

9.97548482345e-05


Temporal stability analysis

+000 deg (BHR)


BHR statistics

Temporal stability [1/decade]:


abs

rel


Weighted least square:

-99999.0


Ordinary least square:

-99999.0


Probabilities that GCOS criteria is met:

Weighted least square:

-99999.0 %

Ordinary least square:

-99999.0 %


DHR statistics

Temporal stability [1/decade]:


abs

rel


Weighted least square:

-99999.0


Ordinary least square:

-99999.0


Probabilities that GCOS criteria is met:

Weighted least square:

-99999.0 %

Ordinary least square:

-99999.0 %


+057/+063 deg (BHR)


BHR statistics

Temporal stability [1/decade]:


abs

rel


Weighted least square:

None


Ordinary least square:

None


Probabilities that GCOS criteria is met:

Weighted least square:

None %

Ordinary least square:

None %


DHR statistics

Temporal stability [1/decade]:


abs

rel


Weighted least square:

None


Ordinary least square:

None


Probabilities that GCOS criteria is met:

Weighted least square:

None %

Ordinary least square:

None %


Temporal anomaly analyis

The variance of the temporal anomalies provides an additional measure about the stability of the signal AFTER removal of the mean seasonal cylce.

+000 deg


+057/+063 deg