DIRECT_00021


Location

lon / lat [deg]: -77.7069 / 44.5875

Source network: DIRECT


Geostationary surface albedo (GSA) data


“+000”


“+057/+063”


Landcover information (based on ESA CCI landcover data)


Landcover fractions @ 2km distance


Landcover fractions @ 20 km distance


Legend


Distance to open water bodies [km]:

3.02

Distance to urban areas [km]:

10.51


Radius: 1 km

Number of landcover classes:

3

Dominant landcover type:

62: Tree cover, broadleaved, decidous (open 15-40%)

Fraction of dominant landcover type [%]:

55.0


Radius: 2 km

Number of landcover classes:

3

Dominant landcover type:

62: Tree cover, broadleaved, decidous (open 15-40%)

Fraction of dominant landcover type [%]:

82.0


Radius: 5 km

Number of landcover classes:

6

Dominant landcover type:

62: Tree cover, broadleaved, decidous (open 15-40%)

Fraction of dominant landcover type [%]:

64.0


Radius: 10 km

Number of landcover classes:

7

Dominant landcover type:

62: Tree cover, broadleaved, decidous (open 15-40%)

Fraction of dominant landcover type [%]:

64.0


Radius: 20 km

Number of landcover classes:

9

Dominant landcover type:

62: Tree cover, broadleaved, decidous (open 15-40%)

Fraction of dominant landcover type [%]:

59.0


Disturbances


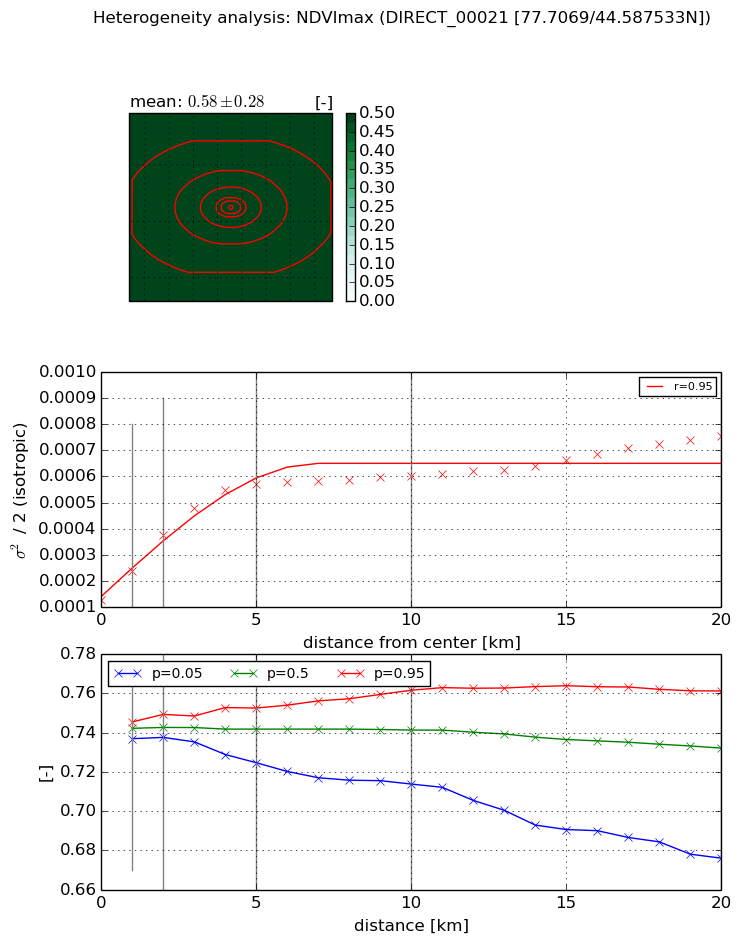
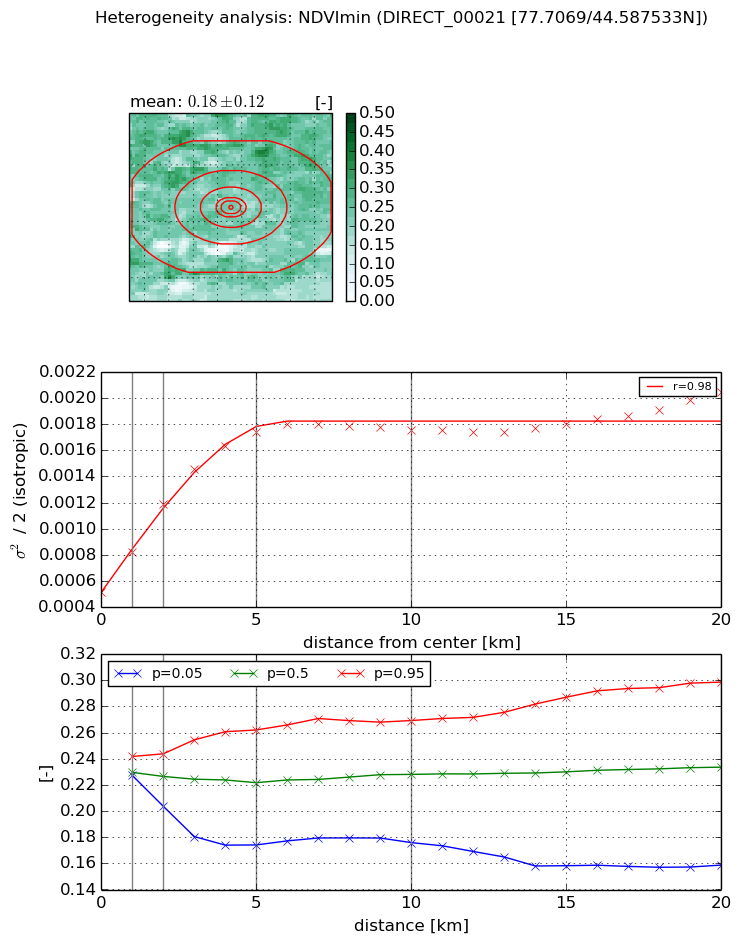
Heterogeneity analysis

The heterogeneity analysis provides information about the spatial and temporal heterogeneity of the site.

Topography


Roman et al. (2009) index


St

1.76395385969

Rcv

0.700724665937

Rse

0.0

Rst

-9.14182796934e-08

Rsv

-0.999999999992


Height range @ 1km [m]

17

Height range @ 2km [m]

23

Height range @ 5km [m]

53

Height range @ 10km [m]

-999

Height range @ 20km [m]

-999


Variance slope @ 1 km

66

Variance slope @ 2 km

46

Variance slope @ 5 km

39

Variance slope @ 10 km

-999

Variance slope @ 20 km

-999


NDVI (max. NDVI composite)


Roman et al. (2009) index


St

0.37949683338

Rcv

0.819829927459

Rse

0.0

Rst

-0.682821034467

Rsv

6.40255334051


NDVI range @ 1km [-]

0.01

NDVI range @ 2km [-]

0.01

NDVI range @ 5km [-]

0.03

NDVI range @ 10km [-]

0.05

NDVI range @ 20km [-]

0.09


Variance slope @ 1 km

0.000112278371324

Variance slope @ 2 km

0.000124867068933

Variance slope @ 5 km

9.28440519645e-05

Variance slope @ 10 km

4.26411073781e-05

Variance slope @ 20 km

2.20032224978e-05


NDVI (min. NDVI composite)I


Roman et al. (2009) index


St

4.26654812445

Rcv

0.223696069156

Rse

0.0

Rst

-0.179854834914

Rsv

0.299593631627


NDVI range @ 1km [-]

0.01

NDVI range @ 2km [-]

0.04

NDVI range @ 5km [-]

0.09

NDVI range @ 10km [-]

0.09

NDVI range @ 20km [-]

0.14


NDVI slope @ 1 km

0.000304509014043

NDVI slope @ 2 km

0.000338681896484

NDVI slope @ 5 km

0.000252326516397

NDVI slope @ 10 km

0.000115531208104

NDVI slope @ 20 km

4.61617236524e-05


Temporal stability analysis

+000 deg (BHR)


BHR statistics

Temporal stability [1/decade]:


abs

rel


Weighted least square:

-99999.0


Ordinary least square:

-99999.0


Probabilities that GCOS criteria is met:

Weighted least square:

-99999.0 %

Ordinary least square:

-99999.0 %


DHR statistics

Temporal stability [1/decade]:


abs

rel


Weighted least square:

-99999.0


Ordinary least square:

-99999.0


Probabilities that GCOS criteria is met:

Weighted least square:

-99999.0 %

Ordinary least square:

-99999.0 %


+057/+063 deg (BHR)


BHR statistics

Temporal stability [1/decade]:


abs

rel


Weighted least square:

None


Ordinary least square:

None


Probabilities that GCOS criteria is met:

Weighted least square:

None %

Ordinary least square:

None %


DHR statistics

Temporal stability [1/decade]:


abs

rel


Weighted least square:

None


Ordinary least square:

None


Probabilities that GCOS criteria is met:

Weighted least square:

None %

Ordinary least square:

None %


Temporal anomaly analyis

The variance of the temporal anomalies provides an additional measure about the stability of the signal AFTER removal of the mean seasonal cylce.

+000 deg


+057/+063 deg