DIRECT_00023


Location

lon / lat [deg]: -77.2695 / 44.7568

Source network: DIRECT


Geostationary surface albedo (GSA) data


“+000”


“+057/+063”


Landcover information (based on ESA CCI landcover data)


Landcover fractions @ 2km distance


Landcover fractions @ 20 km distance


Legend


Distance to open water bodies [km]:

1.84

Distance to urban areas [km]:

8.61


Radius: 1 km

Number of landcover classes:

2

Dominant landcover type:

62: Tree cover, broadleaved, decidous (open 15-40%)

Fraction of dominant landcover type [%]:

96.0


Radius: 2 km

Number of landcover classes:

4

Dominant landcover type:

62: Tree cover, broadleaved, decidous (open 15-40%)

Fraction of dominant landcover type [%]:

91.0


Radius: 5 km

Number of landcover classes:

6

Dominant landcover type:

62: Tree cover, broadleaved, decidous (open 15-40%)

Fraction of dominant landcover type [%]:

82.0


Radius: 10 km

Number of landcover classes:

7

Dominant landcover type:

62: Tree cover, broadleaved, decidous (open 15-40%)

Fraction of dominant landcover type [%]:

72.0


Radius: 20 km

Number of landcover classes:

7

Dominant landcover type:

62: Tree cover, broadleaved, decidous (open 15-40%)

Fraction of dominant landcover type [%]:

62.0


Disturbances


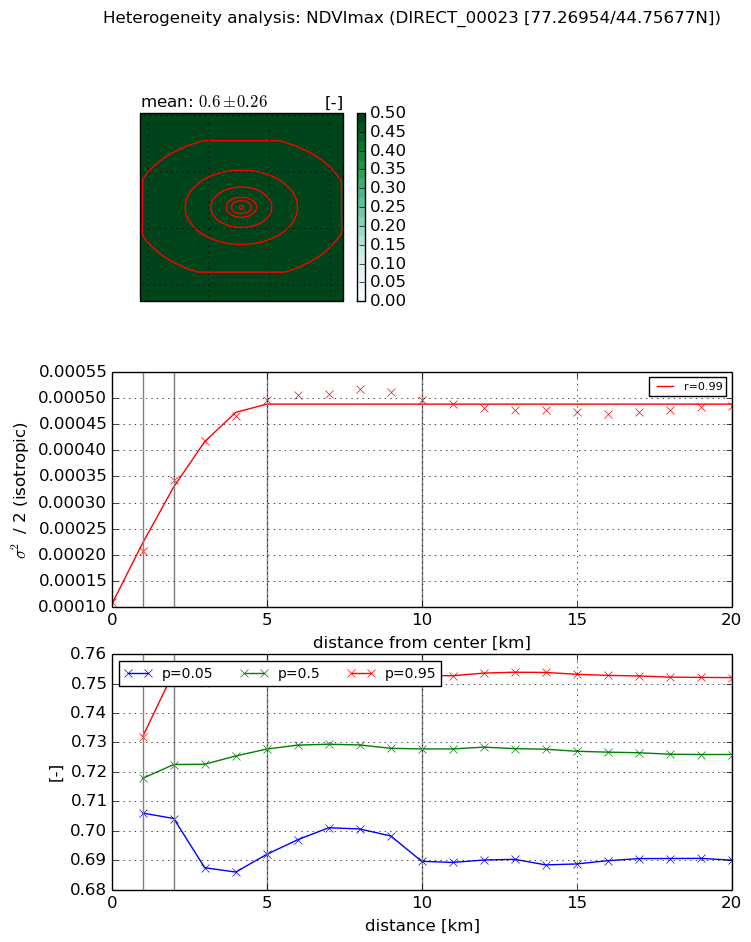
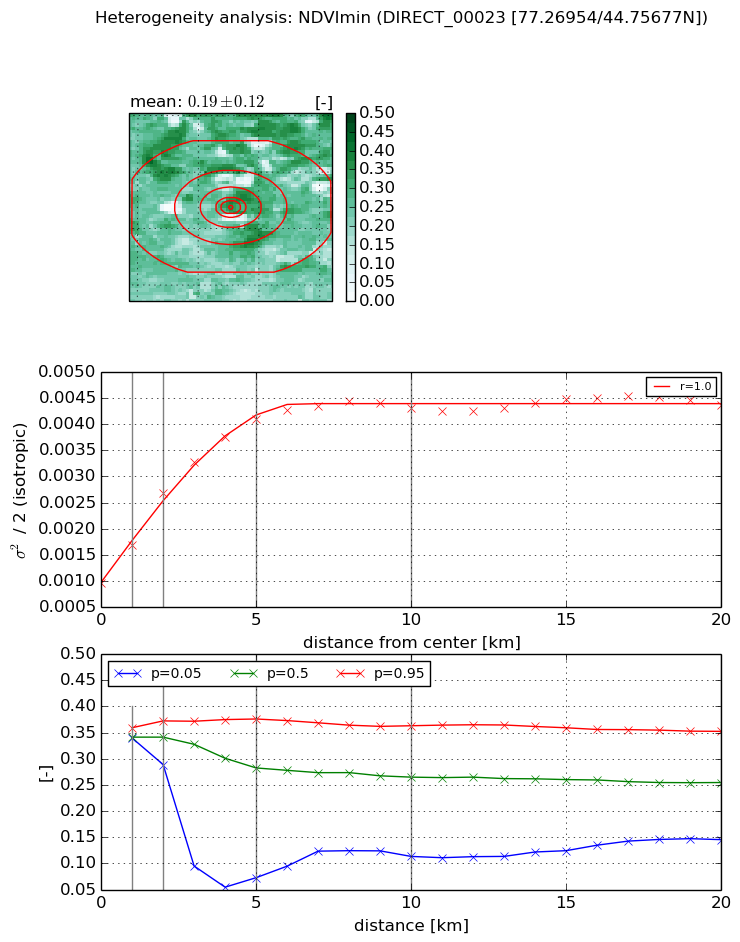
Heterogeneity analysis

The heterogeneity analysis provides information about the spatial and temporal heterogeneity of the site.

Topography


Roman et al. (2009) index


St

5.31836774875

Rcv

-0.049048574772

Rse

0.0

Rst

-8.7247162865e-06

Rsv

-0.515025543543


Height range @ 1km [m]

27

Height range @ 2km [m]

40

Height range @ 5km [m]

53

Height range @ 10km [m]

-999

Height range @ 20km [m]

-999


Variance slope @ 1 km

60

Variance slope @ 2 km

49

Variance slope @ 5 km

40

Variance slope @ 10 km

-999

Variance slope @ 20 km

-999


NDVI (max. NDVI composite)


Roman et al. (2009) index


St

3.4455991914

Rcv

-0.0371919010106

Rse

0.0

Rst

0.431070253625

Rsv

-0.40241369399


NDVI range @ 1km [-]

0.03

NDVI range @ 2km [-]

0.05

NDVI range @ 5km [-]

0.06

NDVI range @ 10km [-]

0.06

NDVI range @ 20km [-]

0.06


Variance slope @ 1 km

9.73953838127e-05

Variance slope @ 2 km

0.000116612842525

Variance slope @ 5 km

7.91954335241e-05

Variance slope @ 10 km

3.53330676575e-05

Variance slope @ 20 km

9.4474035774e-06


NDVI (min. NDVI composite)I


Roman et al. (2009) index


St

4.81857714457e-07

Rcv

0.0841703323314

Rse

0.0

Rst

0.158557799016

Rsv

6225904.02318


NDVI range @ 1km [-]

0.02

NDVI range @ 2km [-]

0.08

NDVI range @ 5km [-]

0.3

NDVI range @ 10km [-]

0.25

NDVI range @ 20km [-]

0.21


NDVI slope @ 1 km

0.000724064645393

NDVI slope @ 2 km

0.000862435427939

NDVI slope @ 5 km

0.000641079955564

NDVI slope @ 10 km

0.000323759670413

NDVI slope @ 20 km

0.000115862475955


Temporal stability analysis

+000 deg (BHR)


BHR statistics

Temporal stability [1/decade]:


abs

rel


Weighted least square:

-99999.0


Ordinary least square:

-99999.0


Probabilities that GCOS criteria is met:

Weighted least square:

-99999.0 %

Ordinary least square:

-99999.0 %


DHR statistics

Temporal stability [1/decade]:


abs

rel


Weighted least square:

-99999.0


Ordinary least square:

-99999.0


Probabilities that GCOS criteria is met:

Weighted least square:

-99999.0 %

Ordinary least square:

-99999.0 %


+057/+063 deg (BHR)


BHR statistics

Temporal stability [1/decade]:


abs

rel


Weighted least square:

None


Ordinary least square:

None


Probabilities that GCOS criteria is met:

Weighted least square:

None %

Ordinary least square:

None %


DHR statistics

Temporal stability [1/decade]:


abs

rel


Weighted least square:

None


Ordinary least square:

None


Probabilities that GCOS criteria is met:

Weighted least square:

None %

Ordinary least square:

None %


Temporal anomaly analyis

The variance of the temporal anomalies provides an additional measure about the stability of the signal AFTER removal of the mean seasonal cylce.

+000 deg


+057/+063 deg


By continuing to use this website, you are giving consent to analytic cookies being used. For more information on how EUMETSAT uses data and how you can disable this, please view this web page: Analytics Cookie Policy