DIRECT_00026


Location

lon / lat [deg]: -78.7827 / 44.7945

Source network: DIRECT


Geostationary surface albedo (GSA) data


“+000”


“+057/+063”


Landcover information (based on ESA CCI landcover data)


Landcover fractions @ 2km distance


Landcover fractions @ 20 km distance


Legend


Distance to open water bodies [km]:

0.93

Distance to urban areas [km]:

10.49


Radius: 1 km

Number of landcover classes:

5

Dominant landcover type:

61: Tree cover, broadleaved, decidous (closed > 40%)

Fraction of dominant landcover type [%]:

50.0


Radius: 2 km

Number of landcover classes:

6

Dominant landcover type:

61: Tree cover, broadleaved, decidous (closed > 40%)

Fraction of dominant landcover type [%]:

36.0


Radius: 5 km

Number of landcover classes:

7

Dominant landcover type:

62: Tree cover, broadleaved, decidous (open 15-40%)

Fraction of dominant landcover type [%]:

35.0


Radius: 10 km

Number of landcover classes:

7

Dominant landcover type:

62: Tree cover, broadleaved, decidous (open 15-40%)

Fraction of dominant landcover type [%]:

41.0


Radius: 20 km

Number of landcover classes:

7

Dominant landcover type:

62: Tree cover, broadleaved, decidous (open 15-40%)

Fraction of dominant landcover type [%]:

47.0


Disturbances


Heterogeneity analysis

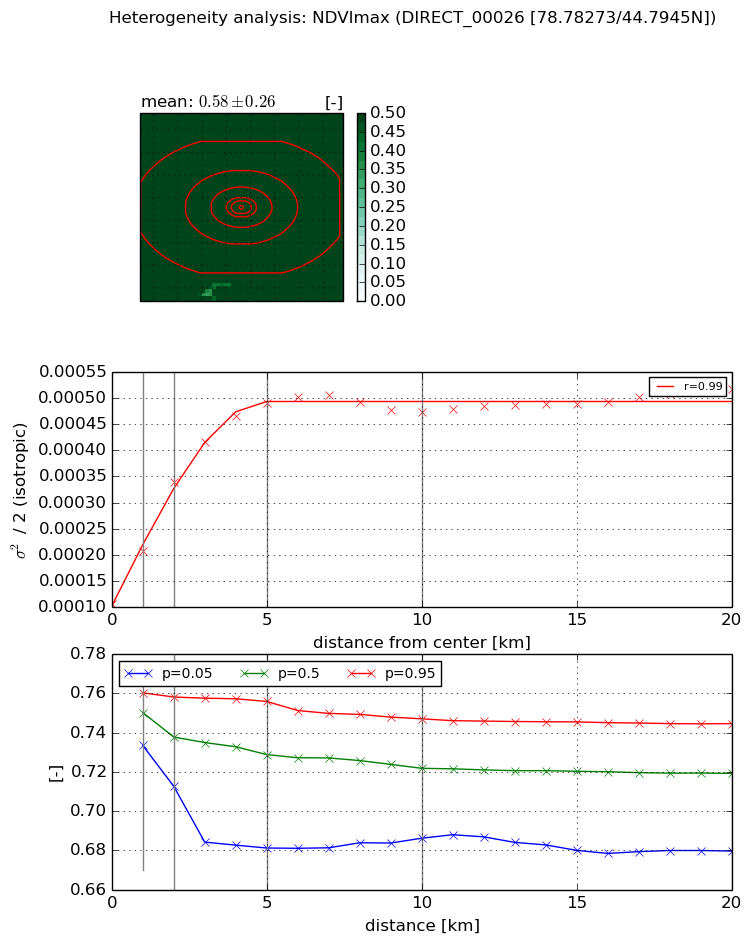
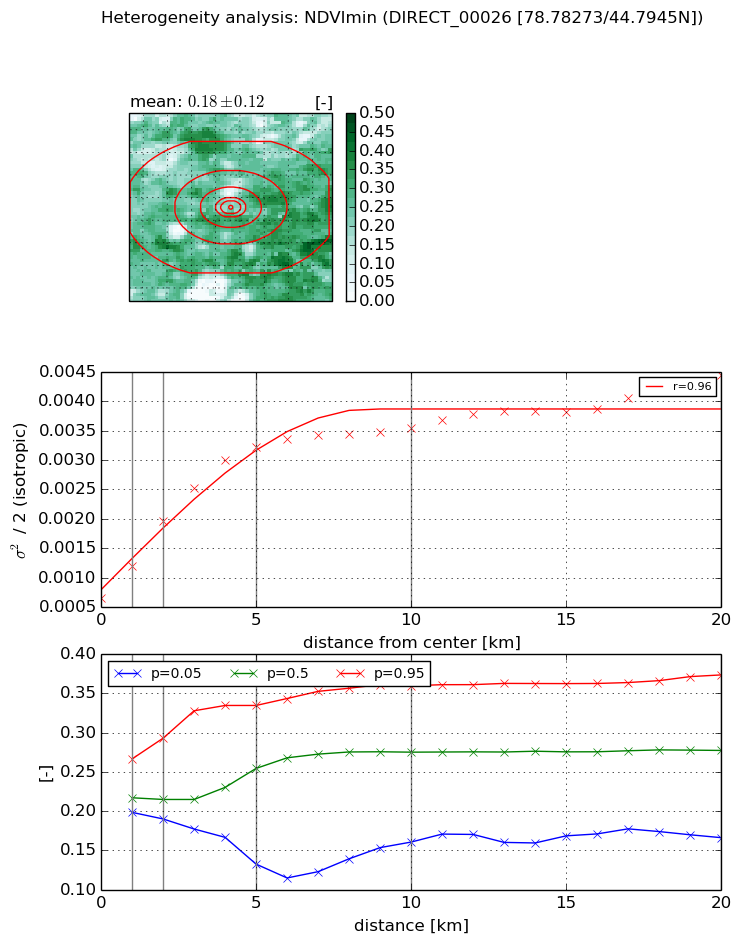
The heterogeneity analysis provides information about the spatial and temporal heterogeneity of the site.

Topography


Roman et al. (2009) index


St

9.92520629612

Rcv

-0.00324078420475

Rse

0.0

Rst

-0.111829020957

Rsv

0.187190914716


Height range @ 1km [m]

26

Height range @ 2km [m]

44

Height range @ 5km [m]

40

Height range @ 10km [m]

-999

Height range @ 20km [m]

-999


Variance slope @ 1 km

80

Variance slope @ 2 km

53

Variance slope @ 5 km

31

Variance slope @ 10 km

-999

Variance slope @ 20 km

-999


NDVI (max. NDVI composite)


Roman et al. (2009) index


St

nan

Rcv

nan

Rse

nan

Rst

nan

Rsv

nan


NDVI range @ 1km [-]

0.03

NDVI range @ 2km [-]

0.05

NDVI range @ 5km [-]

0.07

NDVI range @ 10km [-]

0.06

NDVI range @ 20km [-]

0.07


Variance slope @ 1 km

0.000101569555551

Variance slope @ 2 km

0.000116552074185

Variance slope @ 5 km

7.92859768024e-05

Variance slope @ 10 km

3.26617155399e-05

Variance slope @ 20 km

1.1464303043e-05


NDVI (min. NDVI composite)I


Roman et al. (2009) index


St

1.96986666458

Rcv

0.2619098148

Rse

0.0

Rst

5.21631399443e-10

Rsv

1.26103590174


NDVI range @ 1km [-]

0.07

NDVI range @ 2km [-]

0.1

NDVI range @ 5km [-]

0.2

NDVI range @ 10km [-]

0.2

NDVI range @ 20km [-]

0.21


NDVI slope @ 1 km

0.00054209471786

NDVI slope @ 2 km

0.000654867058185

NDVI slope @ 5 km

0.000536185153176

NDVI slope @ 10 km

0.000273951006039

NDVI slope @ 20 km

0.000138730773283


Temporal stability analysis

+000 deg (BHR)


BHR statistics

Temporal stability [1/decade]:


abs

rel


Weighted least square:

None


Ordinary least square:

None


Probabilities that GCOS criteria is met:

Weighted least square:

None %

Ordinary least square:

None %


DHR statistics

Temporal stability [1/decade]:


abs

rel


Weighted least square:

None


Ordinary least square:

None


Probabilities that GCOS criteria is met:

Weighted least square:

None %

Ordinary least square:

None %


+057/+063 deg (BHR)


BHR statistics

Temporal stability [1/decade]:


abs

rel


Weighted least square:

None


Ordinary least square:

None


Probabilities that GCOS criteria is met:

Weighted least square:

None %

Ordinary least square:

None %


DHR statistics

Temporal stability [1/decade]:


abs

rel


Weighted least square:

None


Ordinary least square:

None


Probabilities that GCOS criteria is met:

Weighted least square:

None %

Ordinary least square:

None %


Temporal anomaly analyis

The variance of the temporal anomalies provides an additional measure about the stability of the signal AFTER removal of the mean seasonal cylce.

+000 deg


+057/+063 deg