DIRECT_00032


Location

lon / lat [deg]: -78.0644 / 44.6579

Source network: DIRECT


Geostationary surface albedo (GSA) data


“+000”


“+057/+063”


Landcover information (based on ESA CCI landcover data)


Landcover fractions @ 2km distance


Landcover fractions @ 20 km distance


Legend


Distance to open water bodies [km]:

1.93

Distance to urban areas [km]:

10.55


Radius: 1 km

Number of landcover classes:

3

Dominant landcover type:

81: Tree cover, needleleaved, deciduous, closed (>40%)

Fraction of dominant landcover type [%]:

49.0


Radius: 2 km

Number of landcover classes:

4

Dominant landcover type:

71: Tree cover, needleleaved, evergreen, closed to open (>40%)

Fraction of dominant landcover type [%]:

39.0


Radius: 5 km

Number of landcover classes:

5

Dominant landcover type:

71: Tree cover, needleleaved, evergreen, closed to open (>40%)

Fraction of dominant landcover type [%]:

50.0


Radius: 10 km

Number of landcover classes:

8

Dominant landcover type:

62: Tree cover, broadleaved, decidous (open 15-40%)

Fraction of dominant landcover type [%]:

31.0


Radius: 20 km

Number of landcover classes:

9

Dominant landcover type:

62: Tree cover, broadleaved, decidous (open 15-40%)

Fraction of dominant landcover type [%]:

45.0


Disturbances


Heterogeneity analysis

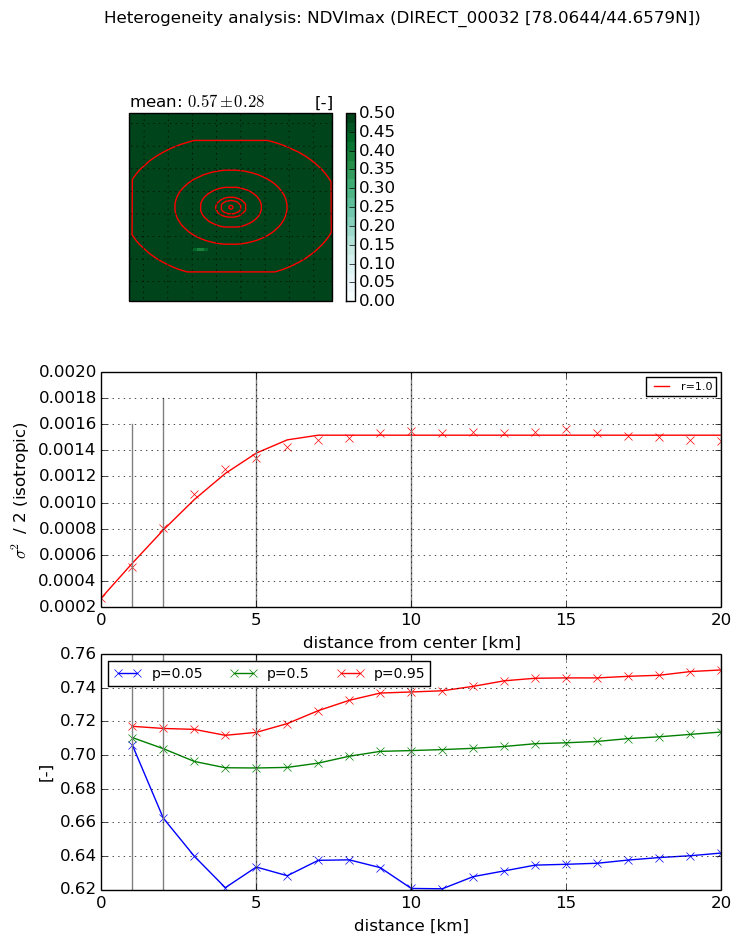
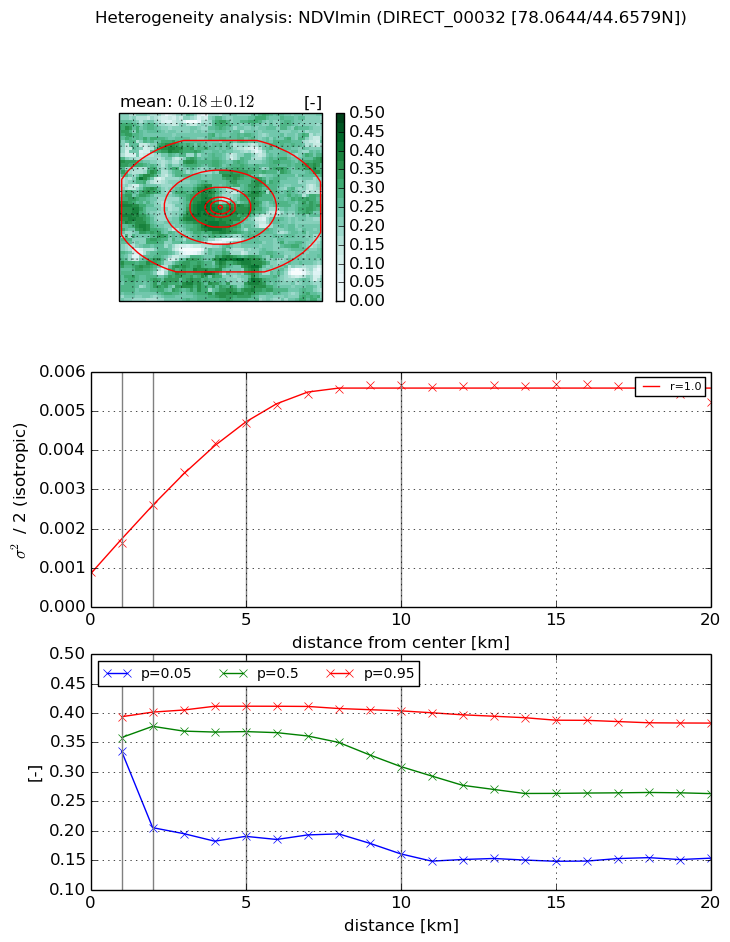
The heterogeneity analysis provides information about the spatial and temporal heterogeneity of the site.

Topography


Roman et al. (2009) index


St

0.0040300435334

Rcv

0.416561556197

Rse

0.0

Rst

3.36821572444e-07

Rsv

743.992270204


Height range @ 1km [m]

12

Height range @ 2km [m]

21

Height range @ 5km [m]

38

Height range @ 10km [m]

-999

Height range @ 20km [m]

-999


Variance slope @ 1 km

36

Variance slope @ 2 km

28

Variance slope @ 5 km

25

Variance slope @ 10 km

-999

Variance slope @ 20 km

-999


NDVI (max. NDVI composite)


Roman et al. (2009) index


St

20.6940870497

Rcv

-0.00740103450397

Rse

0.0

Rst

-0.117110926302

Rsv

0.020456985773


NDVI range @ 1km [-]

0.01

NDVI range @ 2km [-]

0.05

NDVI range @ 5km [-]

0.08

NDVI range @ 10km [-]

0.12

NDVI range @ 20km [-]

0.11


Variance slope @ 1 km

0.000238169206412

Variance slope @ 2 km

0.000270280230946

Variance slope @ 5 km

0.000224652091424

Variance slope @ 10 km

0.000123437899607

Variance slope @ 20 km

4.2825312863e-05


NDVI (min. NDVI composite)I


Roman et al. (2009) index


St

7.09346952528

Rcv

0.0738565795686

Rse

0.0

Rst

-0.0110126697767

Rsv

0.33805496134


NDVI range @ 1km [-]

0.06

NDVI range @ 2km [-]

0.2

NDVI range @ 5km [-]

0.22

NDVI range @ 10km [-]

0.24

NDVI range @ 20km [-]

0.23


NDVI slope @ 1 km

0.000722561287449

NDVI slope @ 2 km

0.000847554802254

NDVI slope @ 5 km

0.000784029792039

NDVI slope @ 10 km

0.000488286805443

NDVI slope @ 20 km

0.000172880256018


Temporal stability analysis

+000 deg (BHR)


BHR statistics

Temporal stability [1/decade]:


abs

rel


Weighted least square:

None


Ordinary least square:

None


Probabilities that GCOS criteria is met:

Weighted least square:

None %

Ordinary least square:

None %


DHR statistics

Temporal stability [1/decade]:


abs

rel


Weighted least square:

None


Ordinary least square:

None


Probabilities that GCOS criteria is met:

Weighted least square:

None %

Ordinary least square:

None %


+057/+063 deg (BHR)


BHR statistics

Temporal stability [1/decade]:


abs

rel


Weighted least square:

None


Ordinary least square:

None


Probabilities that GCOS criteria is met:

Weighted least square:

None %

Ordinary least square:

None %


DHR statistics

Temporal stability [1/decade]:


abs

rel


Weighted least square:

None


Ordinary least square:

None


Probabilities that GCOS criteria is met:

Weighted least square:

None %

Ordinary least square:

None %


Temporal anomaly analyis

The variance of the temporal anomalies provides an additional measure about the stability of the signal AFTER removal of the mean seasonal cylce.

+000 deg


+057/+063 deg