DIRECT_00033


Location

lon / lat [deg]: -98.1579 / 56.0497

Source network: DIRECT


Geostationary surface albedo (GSA) data


“+000”


“+057/+063”


Landcover information (based on ESA CCI landcover data)


Landcover fractions @ 2km distance


Landcover fractions @ 20 km distance


Legend


Distance to open water bodies [km]:

4.24

Distance to urban areas [km]:

37.55


Radius: 1 km

Number of landcover classes:

2

Dominant landcover type:

70: Tree cover, needleleaved, evergreen, closed to open (>15%)

Fraction of dominant landcover type [%]:

97.0


Radius: 2 km

Number of landcover classes:

2

Dominant landcover type:

70: Tree cover, needleleaved, evergreen, closed to open (>15%)

Fraction of dominant landcover type [%]:

98.0


Radius: 5 km

Number of landcover classes:

2

Dominant landcover type:

70: Tree cover, needleleaved, evergreen, closed to open (>15%)

Fraction of dominant landcover type [%]:

97.0


Radius: 10 km

Number of landcover classes:

4

Dominant landcover type:

70: Tree cover, needleleaved, evergreen, closed to open (>15%)

Fraction of dominant landcover type [%]:

93.0


Radius: 20 km

Number of landcover classes:

4

Dominant landcover type:

70: Tree cover, needleleaved, evergreen, closed to open (>15%)

Fraction of dominant landcover type [%]:

90.0


Disturbances


Heterogeneity analysis

The heterogeneity analysis provides information about the spatial and temporal heterogeneity of the site.

Topography


Roman et al. (2009) index


St

3.81295666236e-11

Rcv

0.301077791248

Rse

0.0

Rst

-1.4591339248e-10

Rsv

78679100384.3


Height range @ 1km [m]

13

Height range @ 2km [m]

14

Height range @ 5km [m]

31

Height range @ 10km [m]

-999

Height range @ 20km [m]

-999


Variance slope @ 1 km

28

Variance slope @ 2 km

23

Variance slope @ 5 km

16

Variance slope @ 10 km

-999

Variance slope @ 20 km

-999


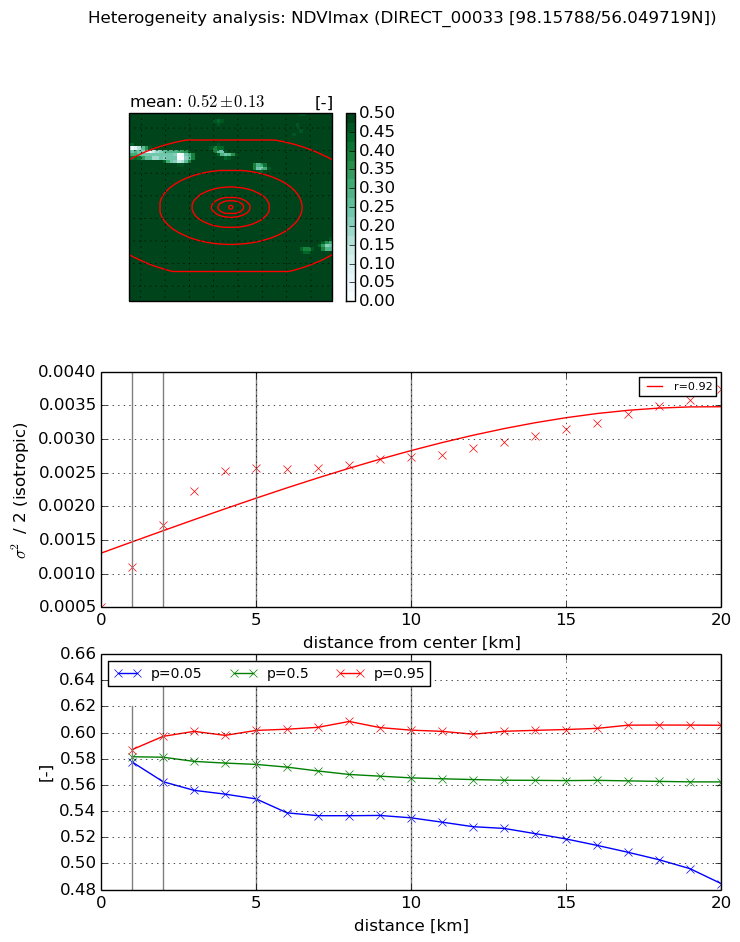
NDVI (max. NDVI composite)


Roman et al. (2009) index


St

5.49955387601

Rcv

0.18222258479

Rse

0.0

Rst

-0.185809122468

Rsv

0.177467085487


NDVI range @ 1km [-]

0.01

NDVI range @ 2km [-]

0.03

NDVI range @ 5km [-]

0.05

NDVI range @ 10km [-]

0.07

NDVI range @ 20km [-]

0.12


Variance slope @ 1 km

0.000590823427964

Variance slope @ 2 km

0.000608055941265

Variance slope @ 5 km

0.000431438517542

Variance slope @ 10 km

0.000191051911022

Variance slope @ 20 km

0.000113930860888


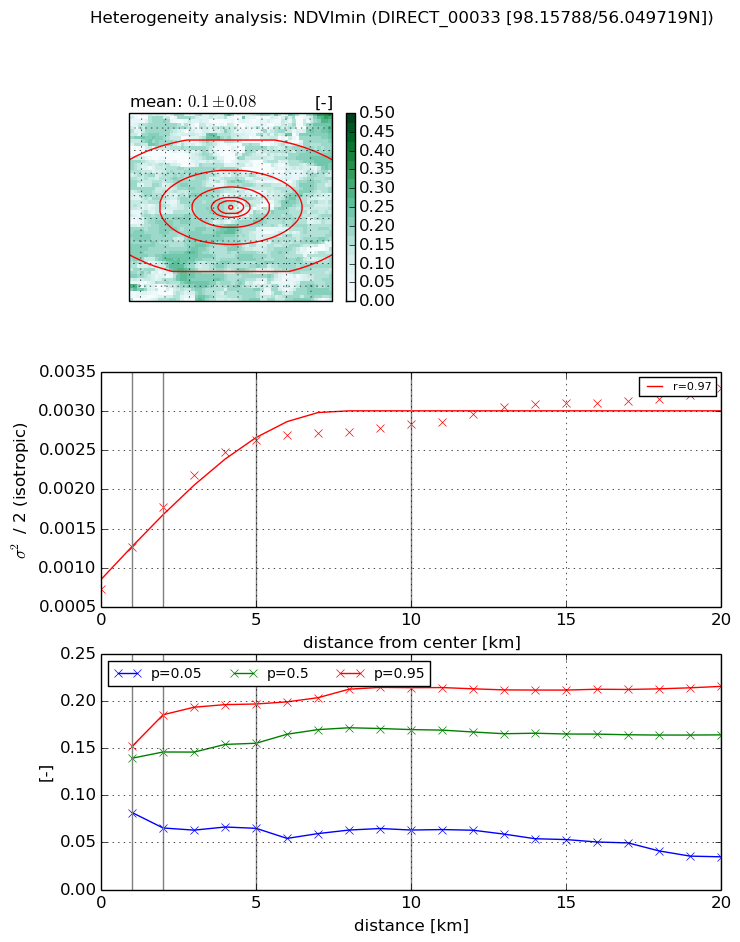
NDVI (min. NDVI composite)I


Roman et al. (2009) index


St

13.2455219289

Rcv

0.0131992313526

Rse

0.0

Rst

-0.150411574686

Rsv

0.0628808351443


NDVI range @ 1km [-]

0.07

NDVI range @ 2km [-]

0.12

NDVI range @ 5km [-]

0.13

NDVI range @ 10km [-]

0.15

NDVI range @ 20km [-]

0.18


NDVI slope @ 1 km

0.000535548657133

NDVI slope @ 2 km

0.00052025067835

NDVI slope @ 5 km

0.000386656194658

NDVI slope @ 10 km

0.00018836533466

NDVI slope @ 20 km

9.06876061563e-05


Temporal stability analysis

+000 deg (BHR)


BHR statistics

Temporal stability [1/decade]:


abs

rel


Weighted least square:

None


Ordinary least square:

None


Probabilities that GCOS criteria is met:

Weighted least square:

None %

Ordinary least square:

None %


DHR statistics

Temporal stability [1/decade]:


abs

rel


Weighted least square:

None


Ordinary least square:

None


Probabilities that GCOS criteria is met:

Weighted least square:

None %

Ordinary least square:

None %


+057/+063 deg (BHR)


BHR statistics

Temporal stability [1/decade]:


abs

rel


Weighted least square:

None


Ordinary least square:

None


Probabilities that GCOS criteria is met:

Weighted least square:

None %

Ordinary least square:

None %


DHR statistics

Temporal stability [1/decade]:


abs

rel


Weighted least square:

None


Ordinary least square:

None


Probabilities that GCOS criteria is met:

Weighted least square:

None %

Ordinary least square:

None %


Temporal anomaly analyis

The variance of the temporal anomalies provides an additional measure about the stability of the signal AFTER removal of the mean seasonal cylce.

+000 deg


+057/+063 deg