DIRECT_00038


Location

lon / lat [deg]: -65.0953 / 44.3249

Source network: DIRECT


Geostationary surface albedo (GSA) data


“+000”


“+057/+063”


Landcover information (based on ESA CCI landcover data)


Landcover fractions @ 2km distance


Landcover fractions @ 20 km distance


Legend


Distance to open water bodies [km]:

1.39

Distance to urban areas [km]:

38.81


Radius: 1 km

Number of landcover classes:

8

Dominant landcover type:

62: Tree cover, broadleaved, decidous (open 15-40%)

Fraction of dominant landcover type [%]:

47.0


Radius: 2 km

Number of landcover classes:

9

Dominant landcover type:

61: Tree cover, broadleaved, decidous (closed > 40%)

Fraction of dominant landcover type [%]:

25.0


Radius: 5 km

Number of landcover classes:

8

Dominant landcover type:

81: Tree cover, needleleaved, deciduous, closed (>40%)

Fraction of dominant landcover type [%]:

51.0


Radius: 10 km

Number of landcover classes:

6

Dominant landcover type:

81: Tree cover, needleleaved, deciduous, closed (>40%)

Fraction of dominant landcover type [%]:

43.0


Radius: 20 km

Number of landcover classes:

7

Dominant landcover type:

81: Tree cover, needleleaved, deciduous, closed (>40%)

Fraction of dominant landcover type [%]:

33.0


Disturbances


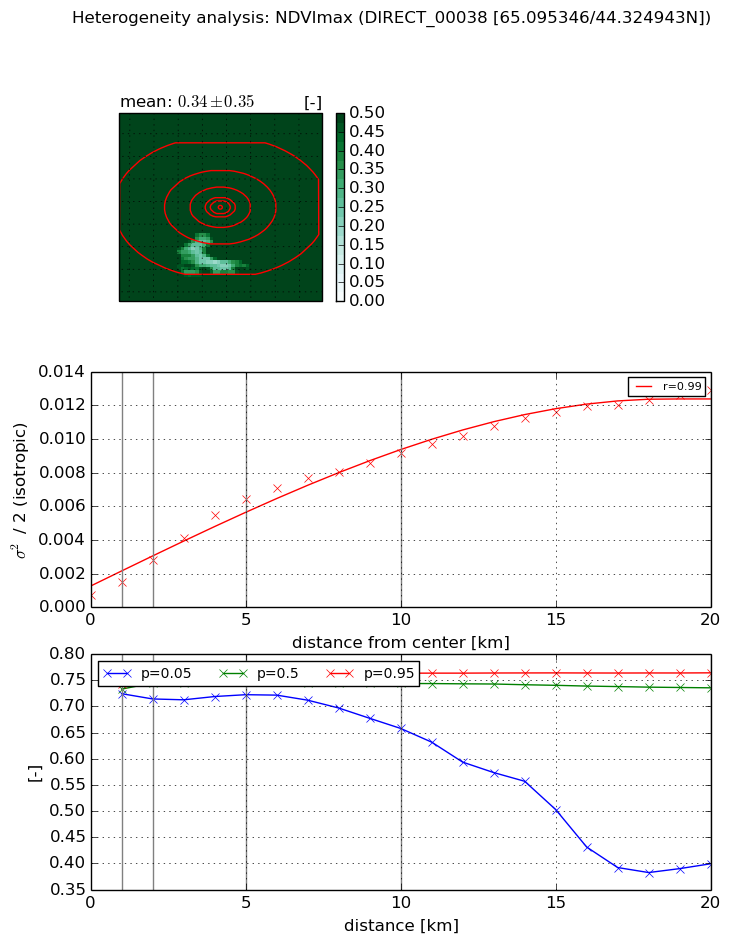
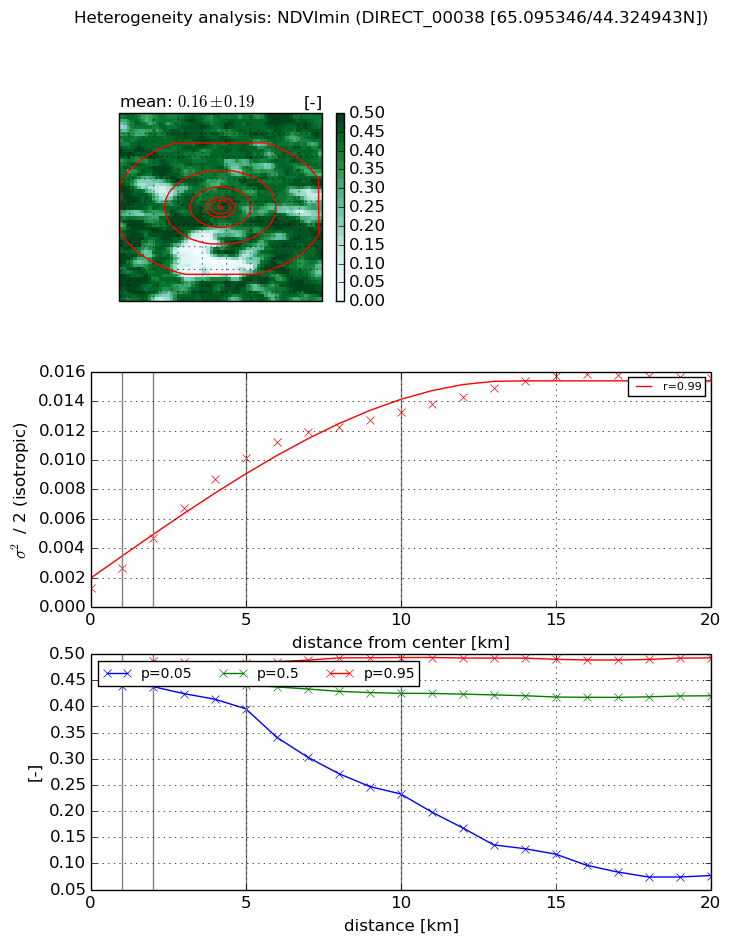
Heterogeneity analysis

The heterogeneity analysis provides information about the spatial and temporal heterogeneity of the site.

Topography


Roman et al. (2009) index


St

16.2692275831

Rcv

0.147577710791

Rse

0.0

Rst

0.00837010821351

Rsv

0.0284493802284


Height range @ 1km [m]

24

Height range @ 2km [m]

36

Height range @ 5km [m]

50

Height range @ 10km [m]

-999

Height range @ 20km [m]

-999


Variance slope @ 1 km

93

Variance slope @ 2 km

70

Variance slope @ 5 km

66

Variance slope @ 10 km

-999

Variance slope @ 20 km

-999


NDVI (max. NDVI composite)


Roman et al. (2009) index


St

9.47993794979

Rcv

-0.238110749809

Rse

0.0

Rst

0.0446083049529

Rsv

-0.0337387127775


NDVI range @ 1km [-]

0.02

NDVI range @ 2km [-]

0.04

NDVI range @ 5km [-]

0.04

NDVI range @ 10km [-]

0.11

NDVI range @ 20km [-]

0.37


Variance slope @ 1 km

0.000809697344938

Variance slope @ 2 km

0.00104808254317

Variance slope @ 5 km

0.00119413412906

Variance slope @ 10 km

0.000864230254983

Variance slope @ 20 km

0.000583639065807


NDVI (min. NDVI composite)I


Roman et al. (2009) index


St

1.46460021303

Rcv

0.818108185306

Rse

0.0

Rst

-0.230234900393

Rsv

-0.999997460286


NDVI range @ 1km [-]

0.02

NDVI range @ 2km [-]

0.05

NDVI range @ 5km [-]

0.09

NDVI range @ 10km [-]

0.26

NDVI range @ 20km [-]

0.42


NDVI slope @ 1 km

0.00133925631721

NDVI slope @ 2 km

0.00169534517278

NDVI slope @ 5 km

0.00183490020627

NDVI slope @ 10 km

0.0012279192027

NDVI slope @ 20 km

0.000664469150644


Temporal stability analysis

+000 deg (BHR)


BHR statistics

Temporal stability [1/decade]:


abs

rel


Weighted least square:

-99999.0


Ordinary least square:

-99999.0


Probabilities that GCOS criteria is met:

Weighted least square:

-99999.0 %

Ordinary least square:

-99999.0 %


DHR statistics

Temporal stability [1/decade]:


abs

rel


Weighted least square:

-99999.0


Ordinary least square:

-99999.0


Probabilities that GCOS criteria is met:

Weighted least square:

-99999.0 %

Ordinary least square:

-99999.0 %


+057/+063 deg (BHR)


BHR statistics

Temporal stability [1/decade]:


abs

rel


Weighted least square:

None


Ordinary least square:

None


Probabilities that GCOS criteria is met:

Weighted least square:

None %

Ordinary least square:

None %


DHR statistics

Temporal stability [1/decade]:


abs

rel


Weighted least square:

None


Ordinary least square:

None


Probabilities that GCOS criteria is met:

Weighted least square:

None %

Ordinary least square:

None %


Temporal anomaly analyis

The variance of the temporal anomalies provides an additional measure about the stability of the signal AFTER removal of the mean seasonal cylce.

+000 deg


+057/+063 deg