DIRECT_00043


Location

lon / lat [deg]: -2.0743 / 39.0281

Source network: DIRECT


Geostationary surface albedo (GSA) data


“+000”


“+057/+063”


Landcover information (based on ESA CCI landcover data)


Landcover fractions @ 2km distance


Landcover fractions @ 20 km distance


Legend


Distance to open water bodies [km]:

3.94

Distance to urban areas [km]:

11.1


Radius: 1 km

Number of landcover classes:

3

Dominant landcover type:

10: cropland, rainfed

Fraction of dominant landcover type [%]:

63.0


Radius: 2 km

Number of landcover classes:

3

Dominant landcover type:

10: cropland, rainfed

Fraction of dominant landcover type [%]:

54.0


Radius: 5 km

Number of landcover classes:

3

Dominant landcover type:

10: cropland, rainfed

Fraction of dominant landcover type [%]:

45.0


Radius: 10 km

Number of landcover classes:

3

Dominant landcover type:

20: cropland, irrigated or post-flooded

Fraction of dominant landcover type [%]:

57.0


Radius: 20 km

Number of landcover classes:

4

Dominant landcover type:

20: cropland, irrigated or post-flooded

Fraction of dominant landcover type [%]:

46.0


Disturbances


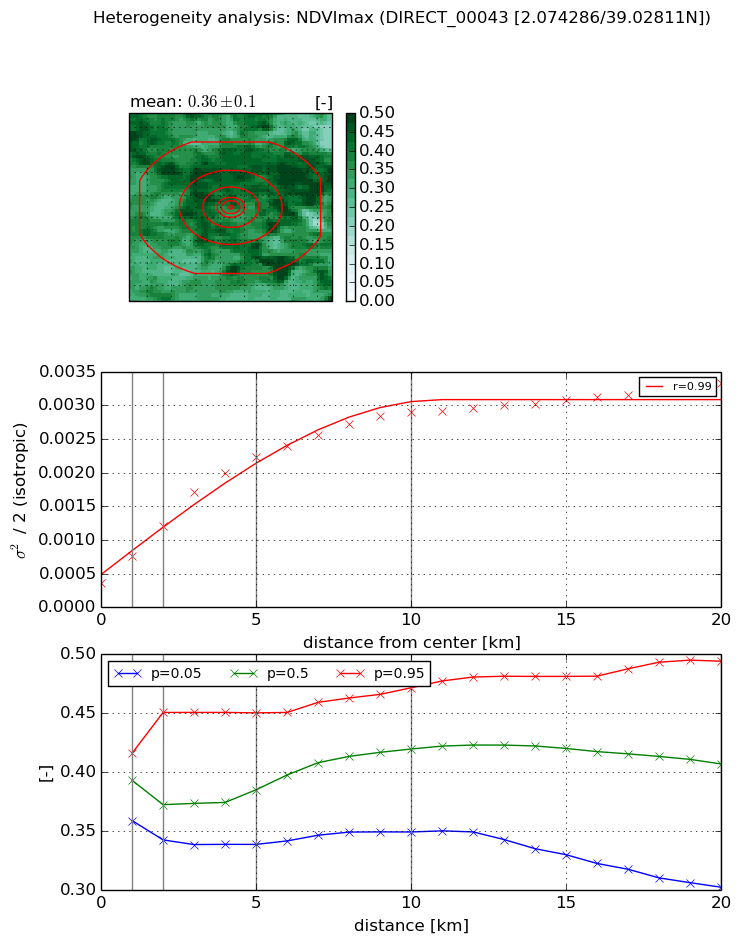
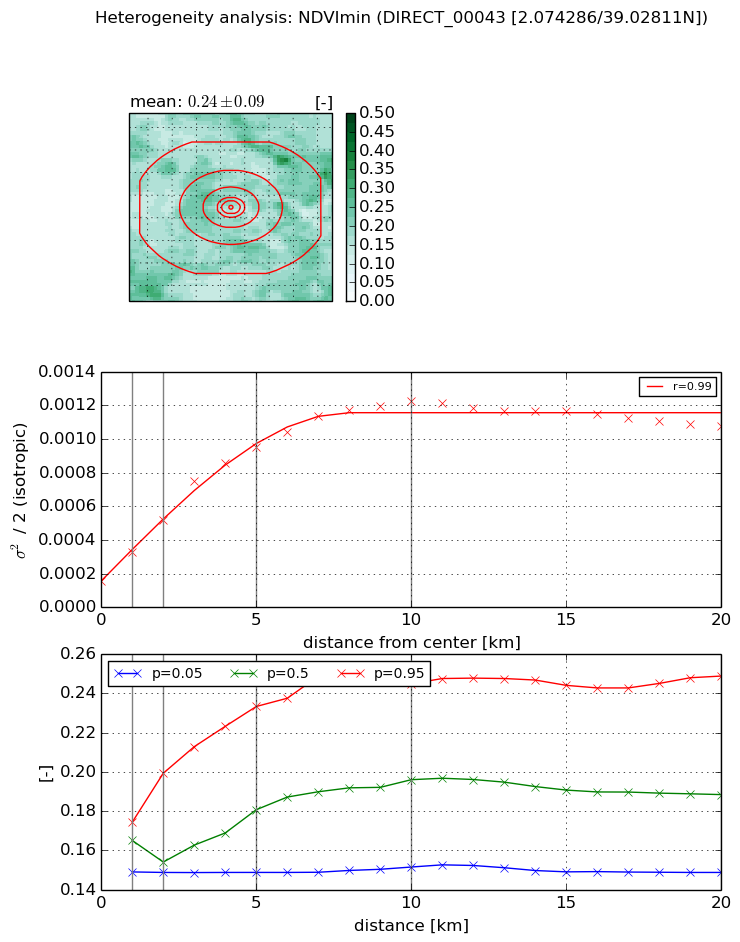
Heterogeneity analysis

The heterogeneity analysis provides information about the spatial and temporal heterogeneity of the site.

Topography


Roman et al. (2009) index


St

2.18581054352

Rcv

0.394269510323

Rse

0.0

Rst

-1.48807517352e-08

Rsv

-0.978219050667


Height range @ 1km [m]

5

Height range @ 2km [m]

9

Height range @ 5km [m]

17

Height range @ 10km [m]

-999

Height range @ 20km [m]

-999


Variance slope @ 1 km

2

Variance slope @ 2 km

3

Variance slope @ 5 km

5

Variance slope @ 10 km

-999

Variance slope @ 20 km

-999


NDVI (max. NDVI composite)


Roman et al. (2009) index


St

2.86652666978e-07

Rcv

-0.0219749338409

Rse

0.0

Rst

0.0957386301237

Rsv

10465627.262


NDVI range @ 1km [-]

0.06

NDVI range @ 2km [-]

0.11

NDVI range @ 5km [-]

0.11

NDVI range @ 10km [-]

0.12

NDVI range @ 20km [-]

0.19


Variance slope @ 1 km

0.000395084530018

Variance slope @ 2 km

0.000418186765957

Variance slope @ 5 km

0.000387927488391

Variance slope @ 10 km

0.000252112475111

Variance slope @ 20 km

0.000121988771026


NDVI (min. NDVI composite)I


Roman et al. (2009) index


St

3.24279270746

Rcv

0.0797614059617

Rse

0.0

Rst

-0.242035907616

Rsv

0.603331200834


NDVI range @ 1km [-]

0.03

NDVI range @ 2km [-]

0.05

NDVI range @ 5km [-]

0.08

NDVI range @ 10km [-]

0.09

NDVI range @ 20km [-]

0.1


NDVI slope @ 1 km

0.000171269484546

NDVI slope @ 2 km

0.000180671805351

NDVI slope @ 5 km

0.000166200238206

NDVI slope @ 10 km

0.000107040884889

NDVI slope @ 20 km

3.50640731347e-05


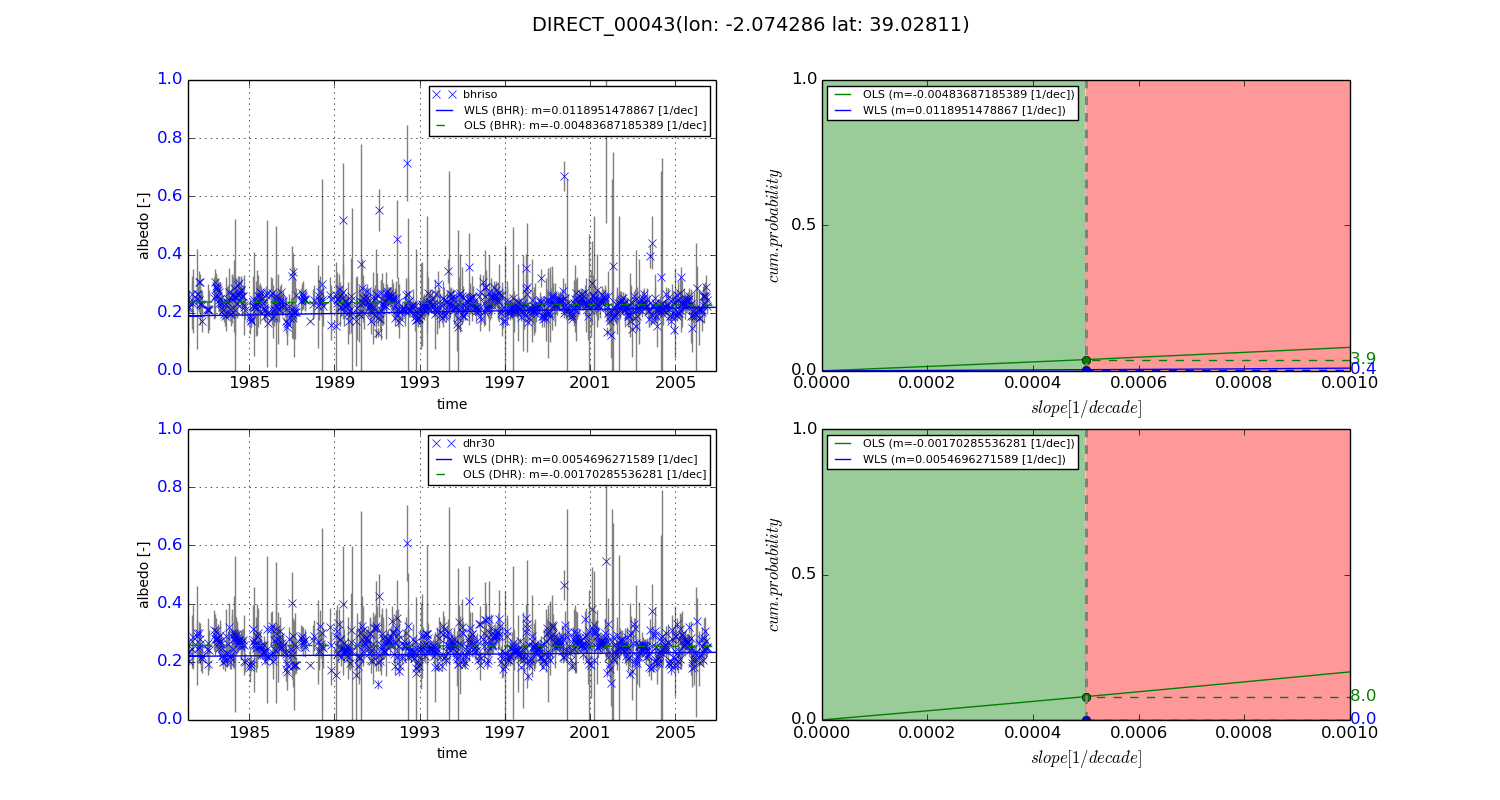
Temporal stability analysis

+000 deg (BHR)


BHR statistics

Temporal stability [1/decade]:


abs

rel


Weighted least square:

0.0118951478867


Ordinary least square:

-0.00483687185389


Probabilities that GCOS criteria is met:

Weighted least square:

0.4 %

Ordinary least square:

3.9 %


DHR statistics

Temporal stability [1/decade]:


abs

rel


Weighted least square:

0.0054696271589


Ordinary least square:

-0.00170285536281


Probabilities that GCOS criteria is met:

Weighted least square:

0.0 %

Ordinary least square:

8.0 %


+057/+063 deg (BHR)


BHR statistics

Temporal stability [1/decade]:


abs

rel


Weighted least square:

-99999.0


Ordinary least square:

-99999.0


Probabilities that GCOS criteria is met:

Weighted least square:

-99999.0 %

Ordinary least square:

-99999.0 %


DHR statistics

Temporal stability [1/decade]:


abs

rel


Weighted least square:

-99999.0


Ordinary least square:

-99999.0


Probabilities that GCOS criteria is met:

Weighted least square:

-99999.0 %

Ordinary least square:

-99999.0 %


Temporal anomaly analyis

The variance of the temporal anomalies provides an additional measure about the stability of the signal AFTER removal of the mean seasonal cylce.
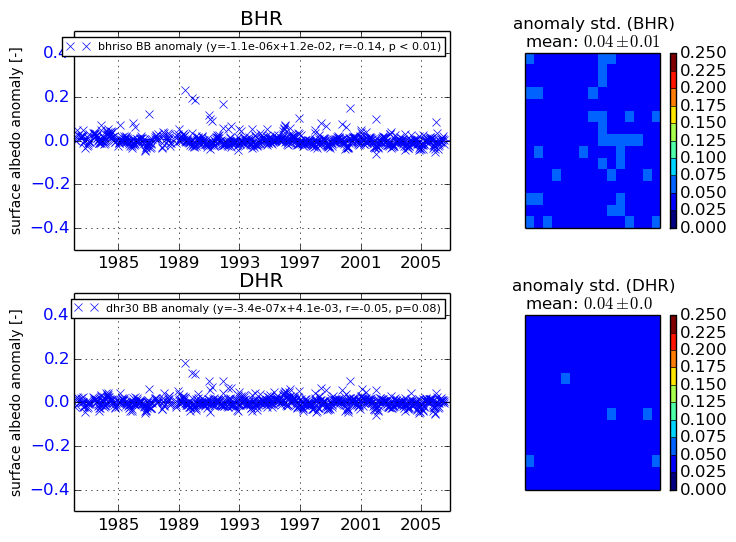
+000 deg


+057/+063 deg